
This guide will assist you in using and understanding the OpenICE Applications ('apps'). Currently, the Supervisor applications are experimental and should be used with caution. Once you start the OpenICE Supervisor, a grid of app icons will appear on the left side of the screen. To open the app, click on the icon. To exit the app and return to the Supervisor home screen, click the 'Exit App' button in the bottom left. The OpenICE Supervisor will close you 'x' out of the entire window.
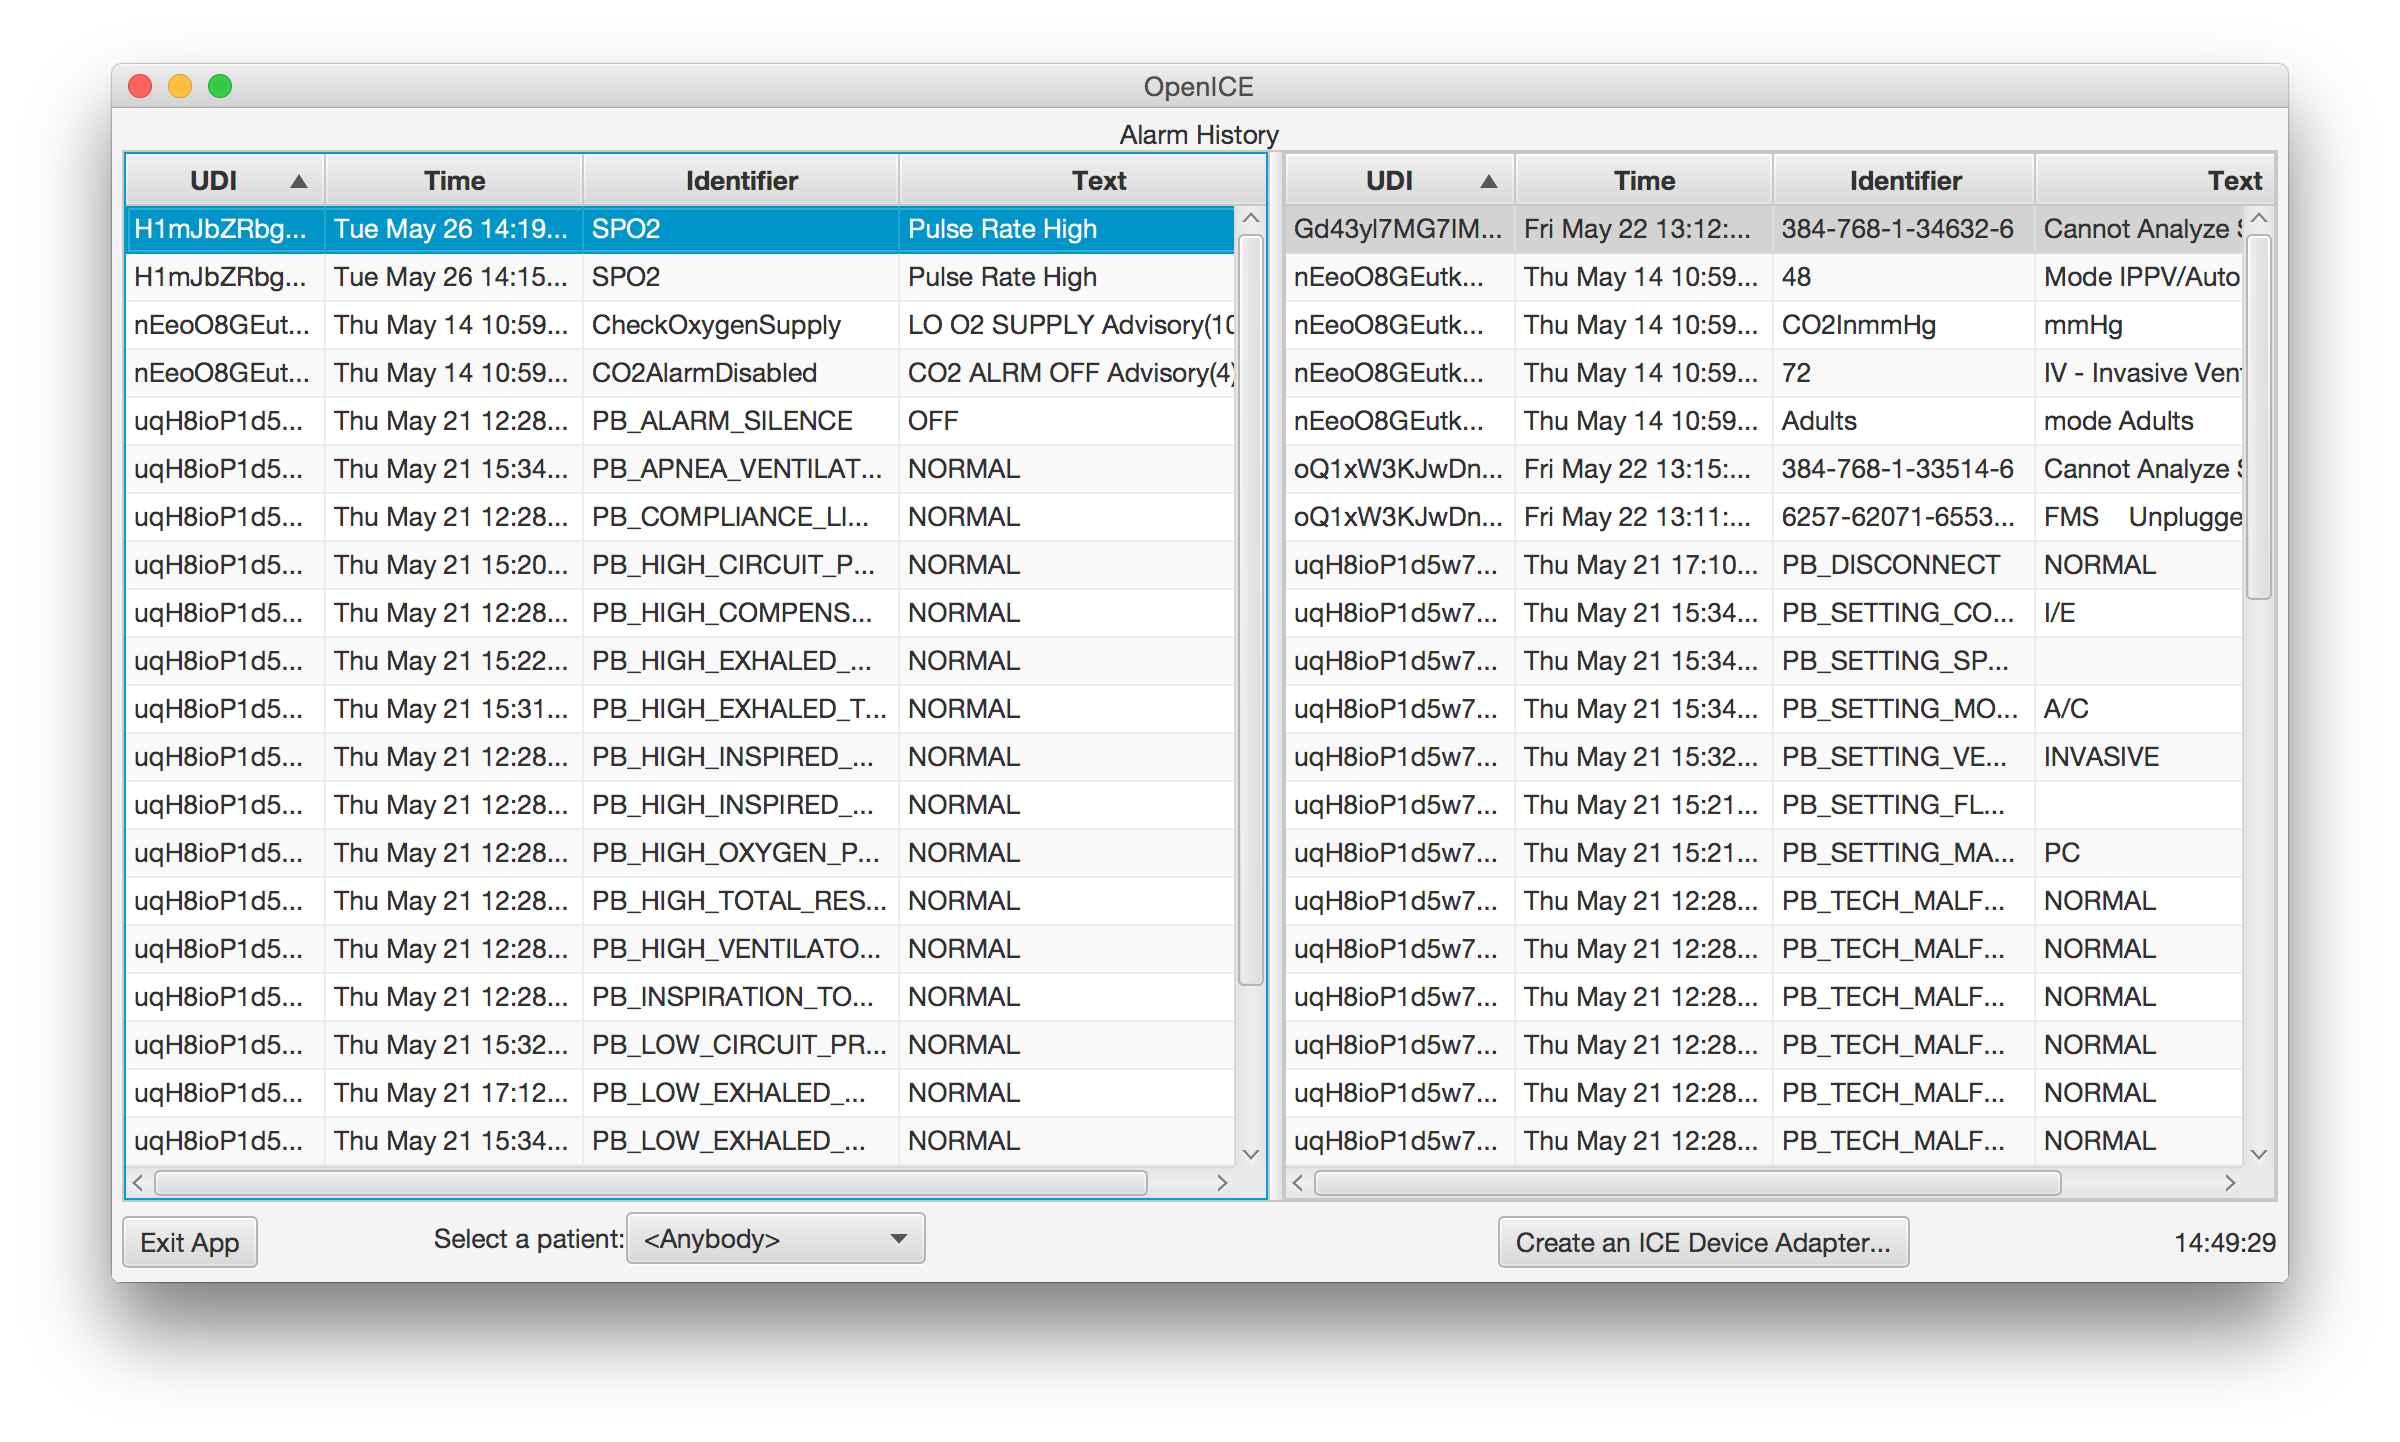
This app displays all of alarms that have triggered, from a specific device, since the time the app was started. Once you open the app, two large boxes appear, the table on the left displays patient alarms and the table on the right displays technical alarms. The four column headings listed below are displayed (in both the patient alarms table and the technical alarms table) when running this app. You may sort the alarms by any of the headings by clicking on the heading itself. An arrow next to the heading will appear after clicking the title to show the direction that the data has been sorted (see image below for example). The length of each column may also be made longer or shorter by selecting the line in between each column and dragging it forwards or backwards. We believe that an app such as this one may help provide a better understanding of false and nuisance alarms through post hoc analysis.
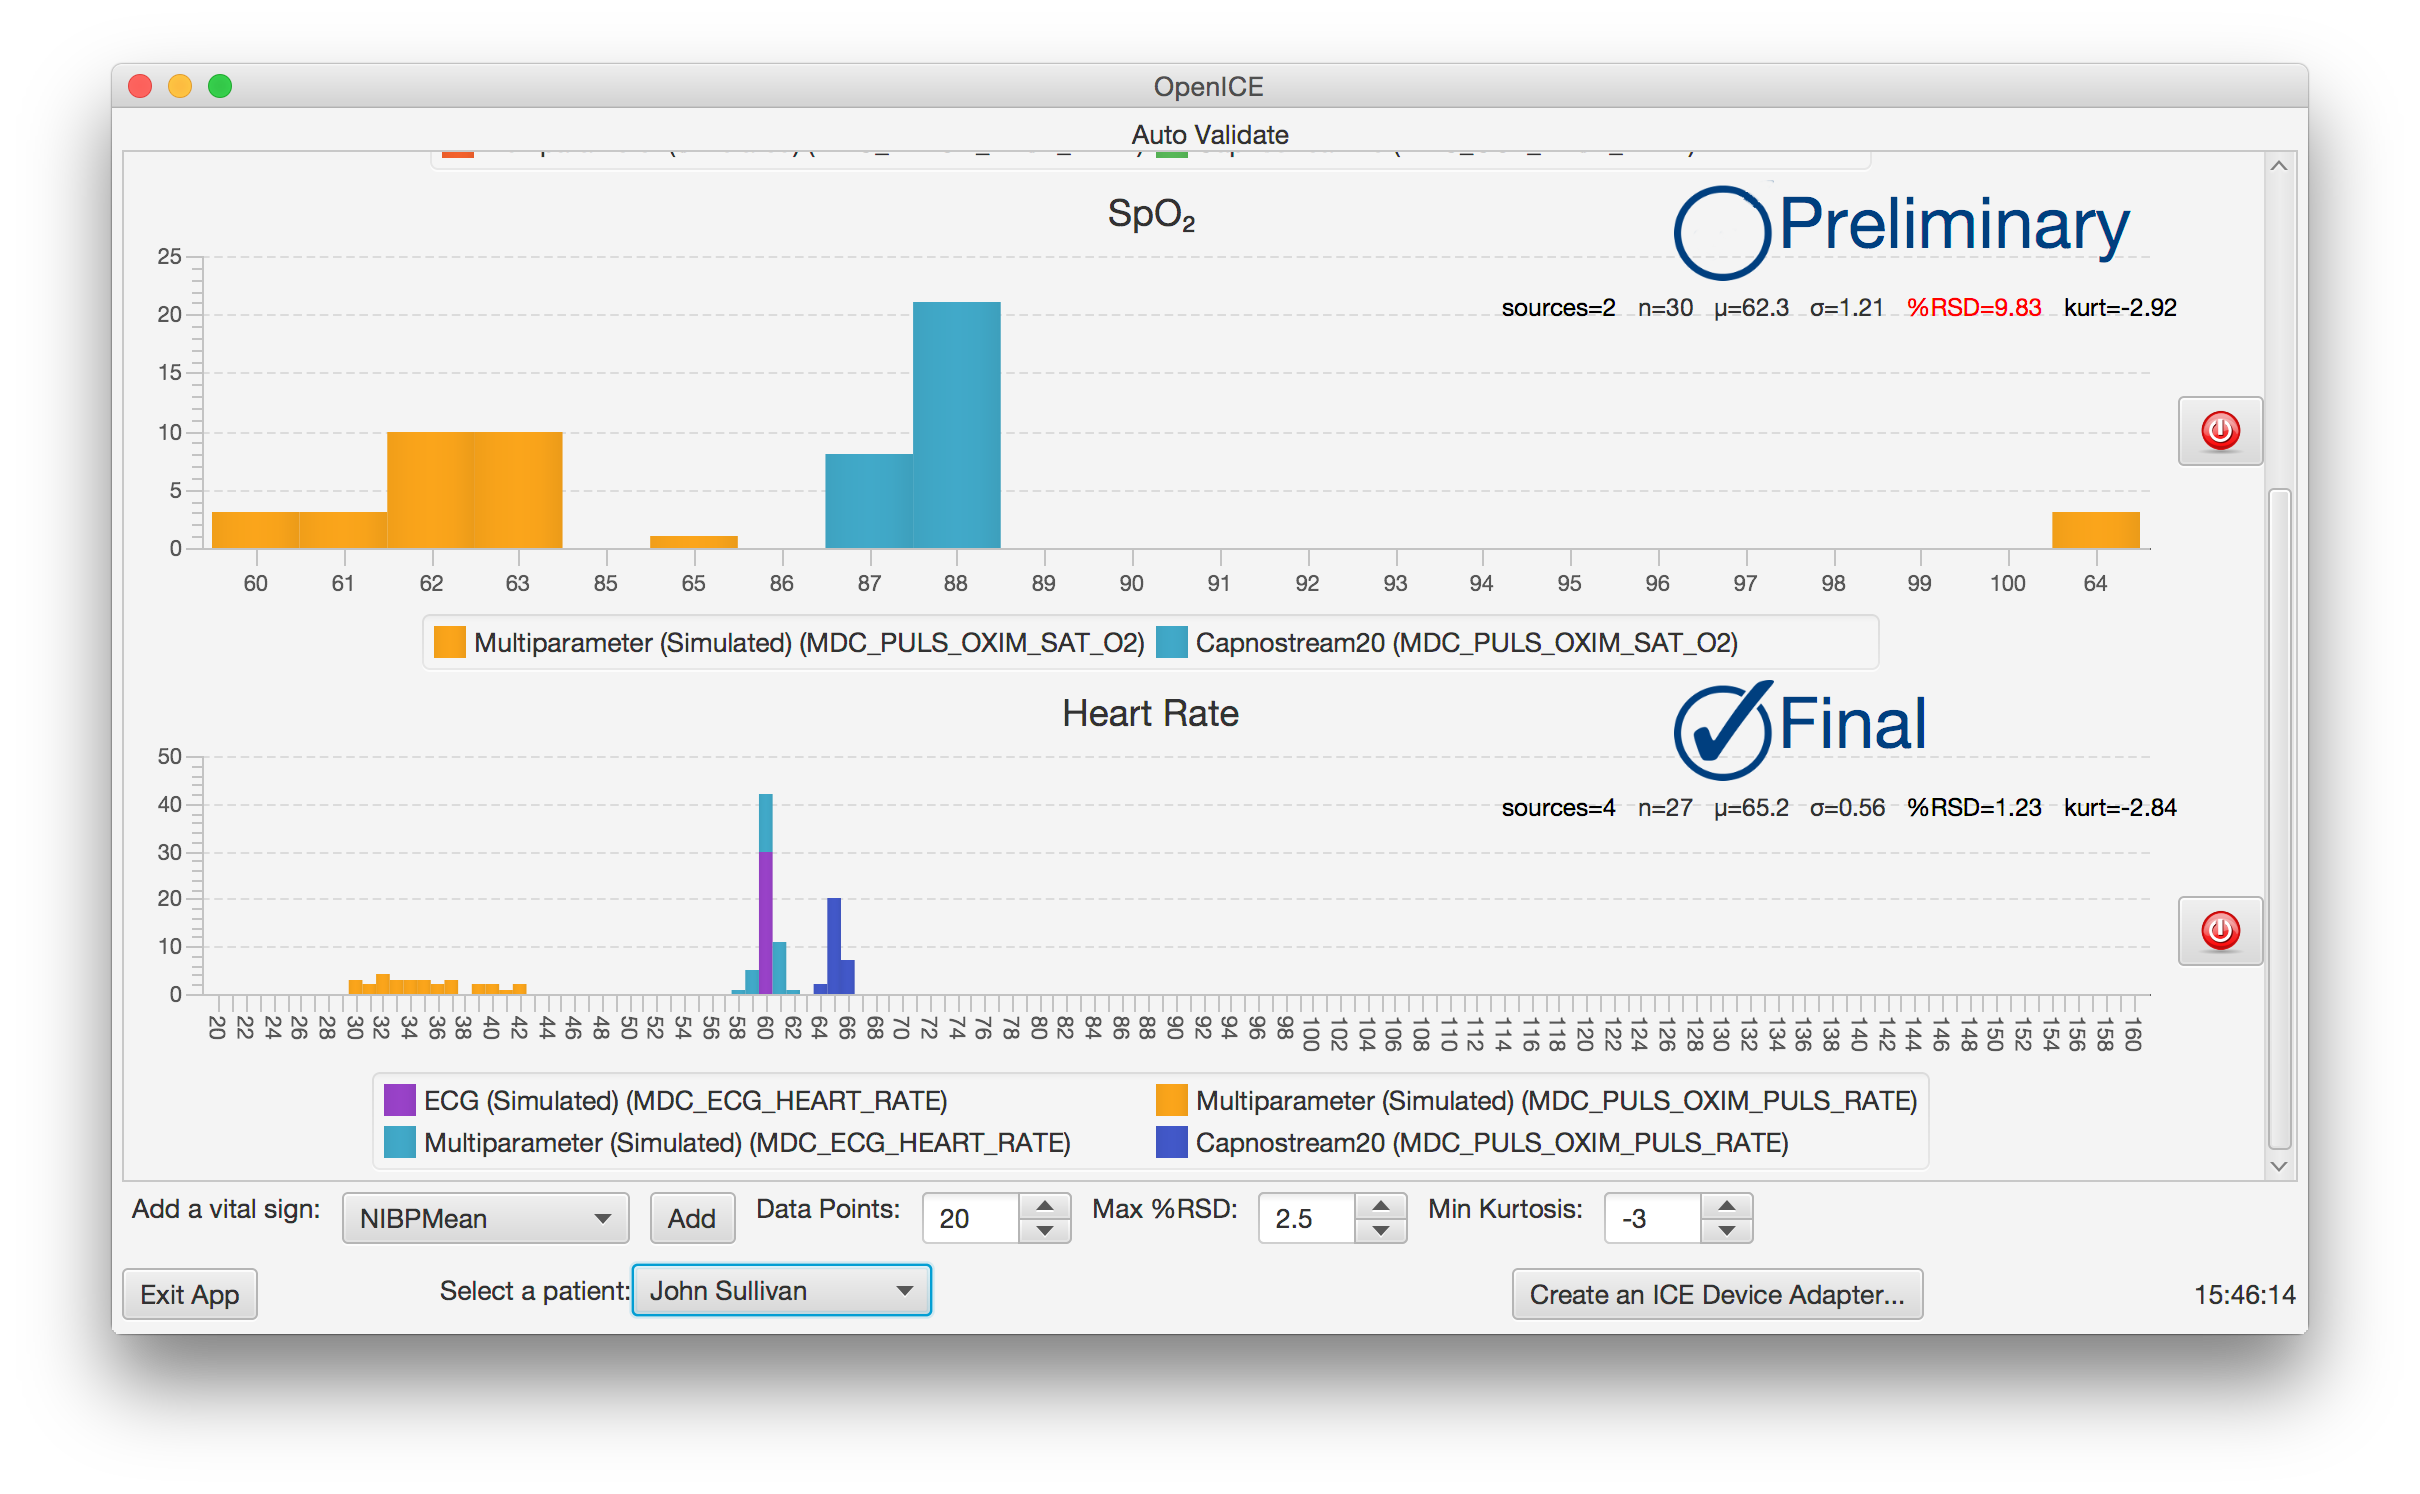
This app displays and automatically validates vital sign data from at least one physiological monitor. The main display of this app contains histograms of vital signs data emitted from various monitors. The purpose of this app is to allow the user to view vital sign data emitted from different monitors that represent the same physiological measurements and to validate the accuracy of this data. This app was MD PnP's HIMSS15 demonstration.
Within each histogram, the following is displayed:
The following is displayed at the bottom of the screen:
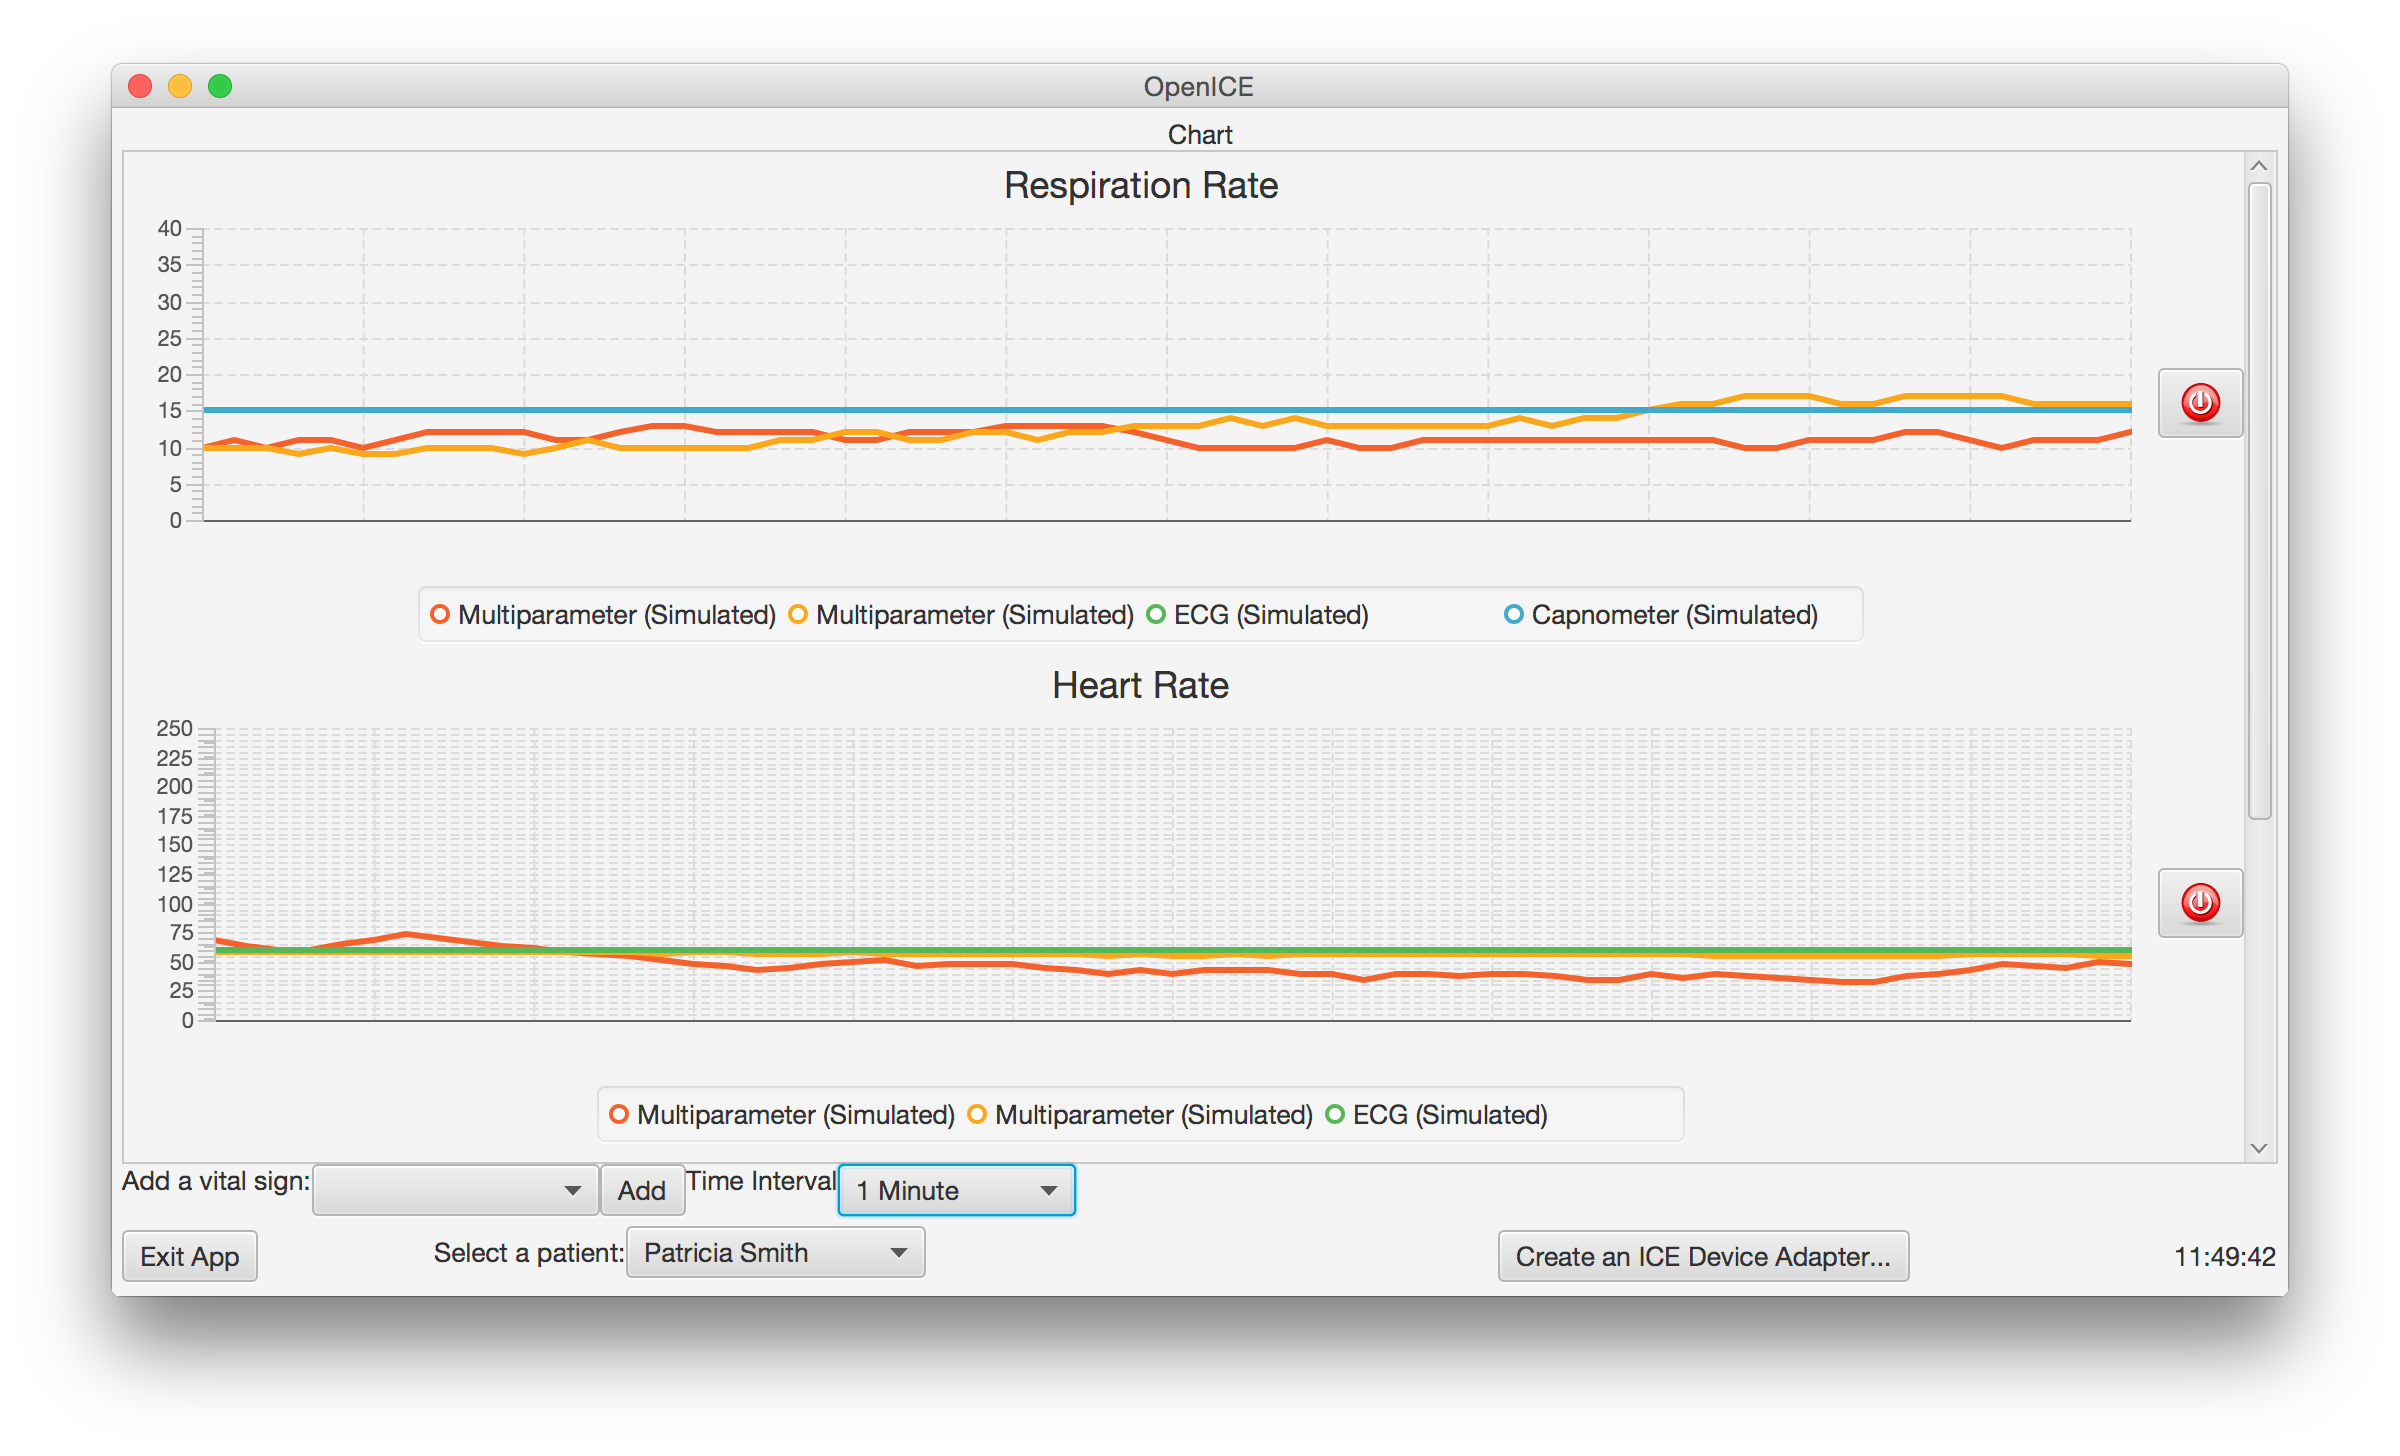
This app displays trends vital signs data from the connected medical devices. The trends are represented by a scrolling line graph that is visually similar to a digital nursing flow sheet. Each vital sign type has one graph, and each graph may have several data points if the data is emitted from more than one monitor or device. In this case, each data point (or line) will be a different color, and a legend below the graph will state where the data is coming from. This data is displayed over a predetermined amount of time. This app allows the user to see the potential variability in vital signs data that comes from different monitors or devices.
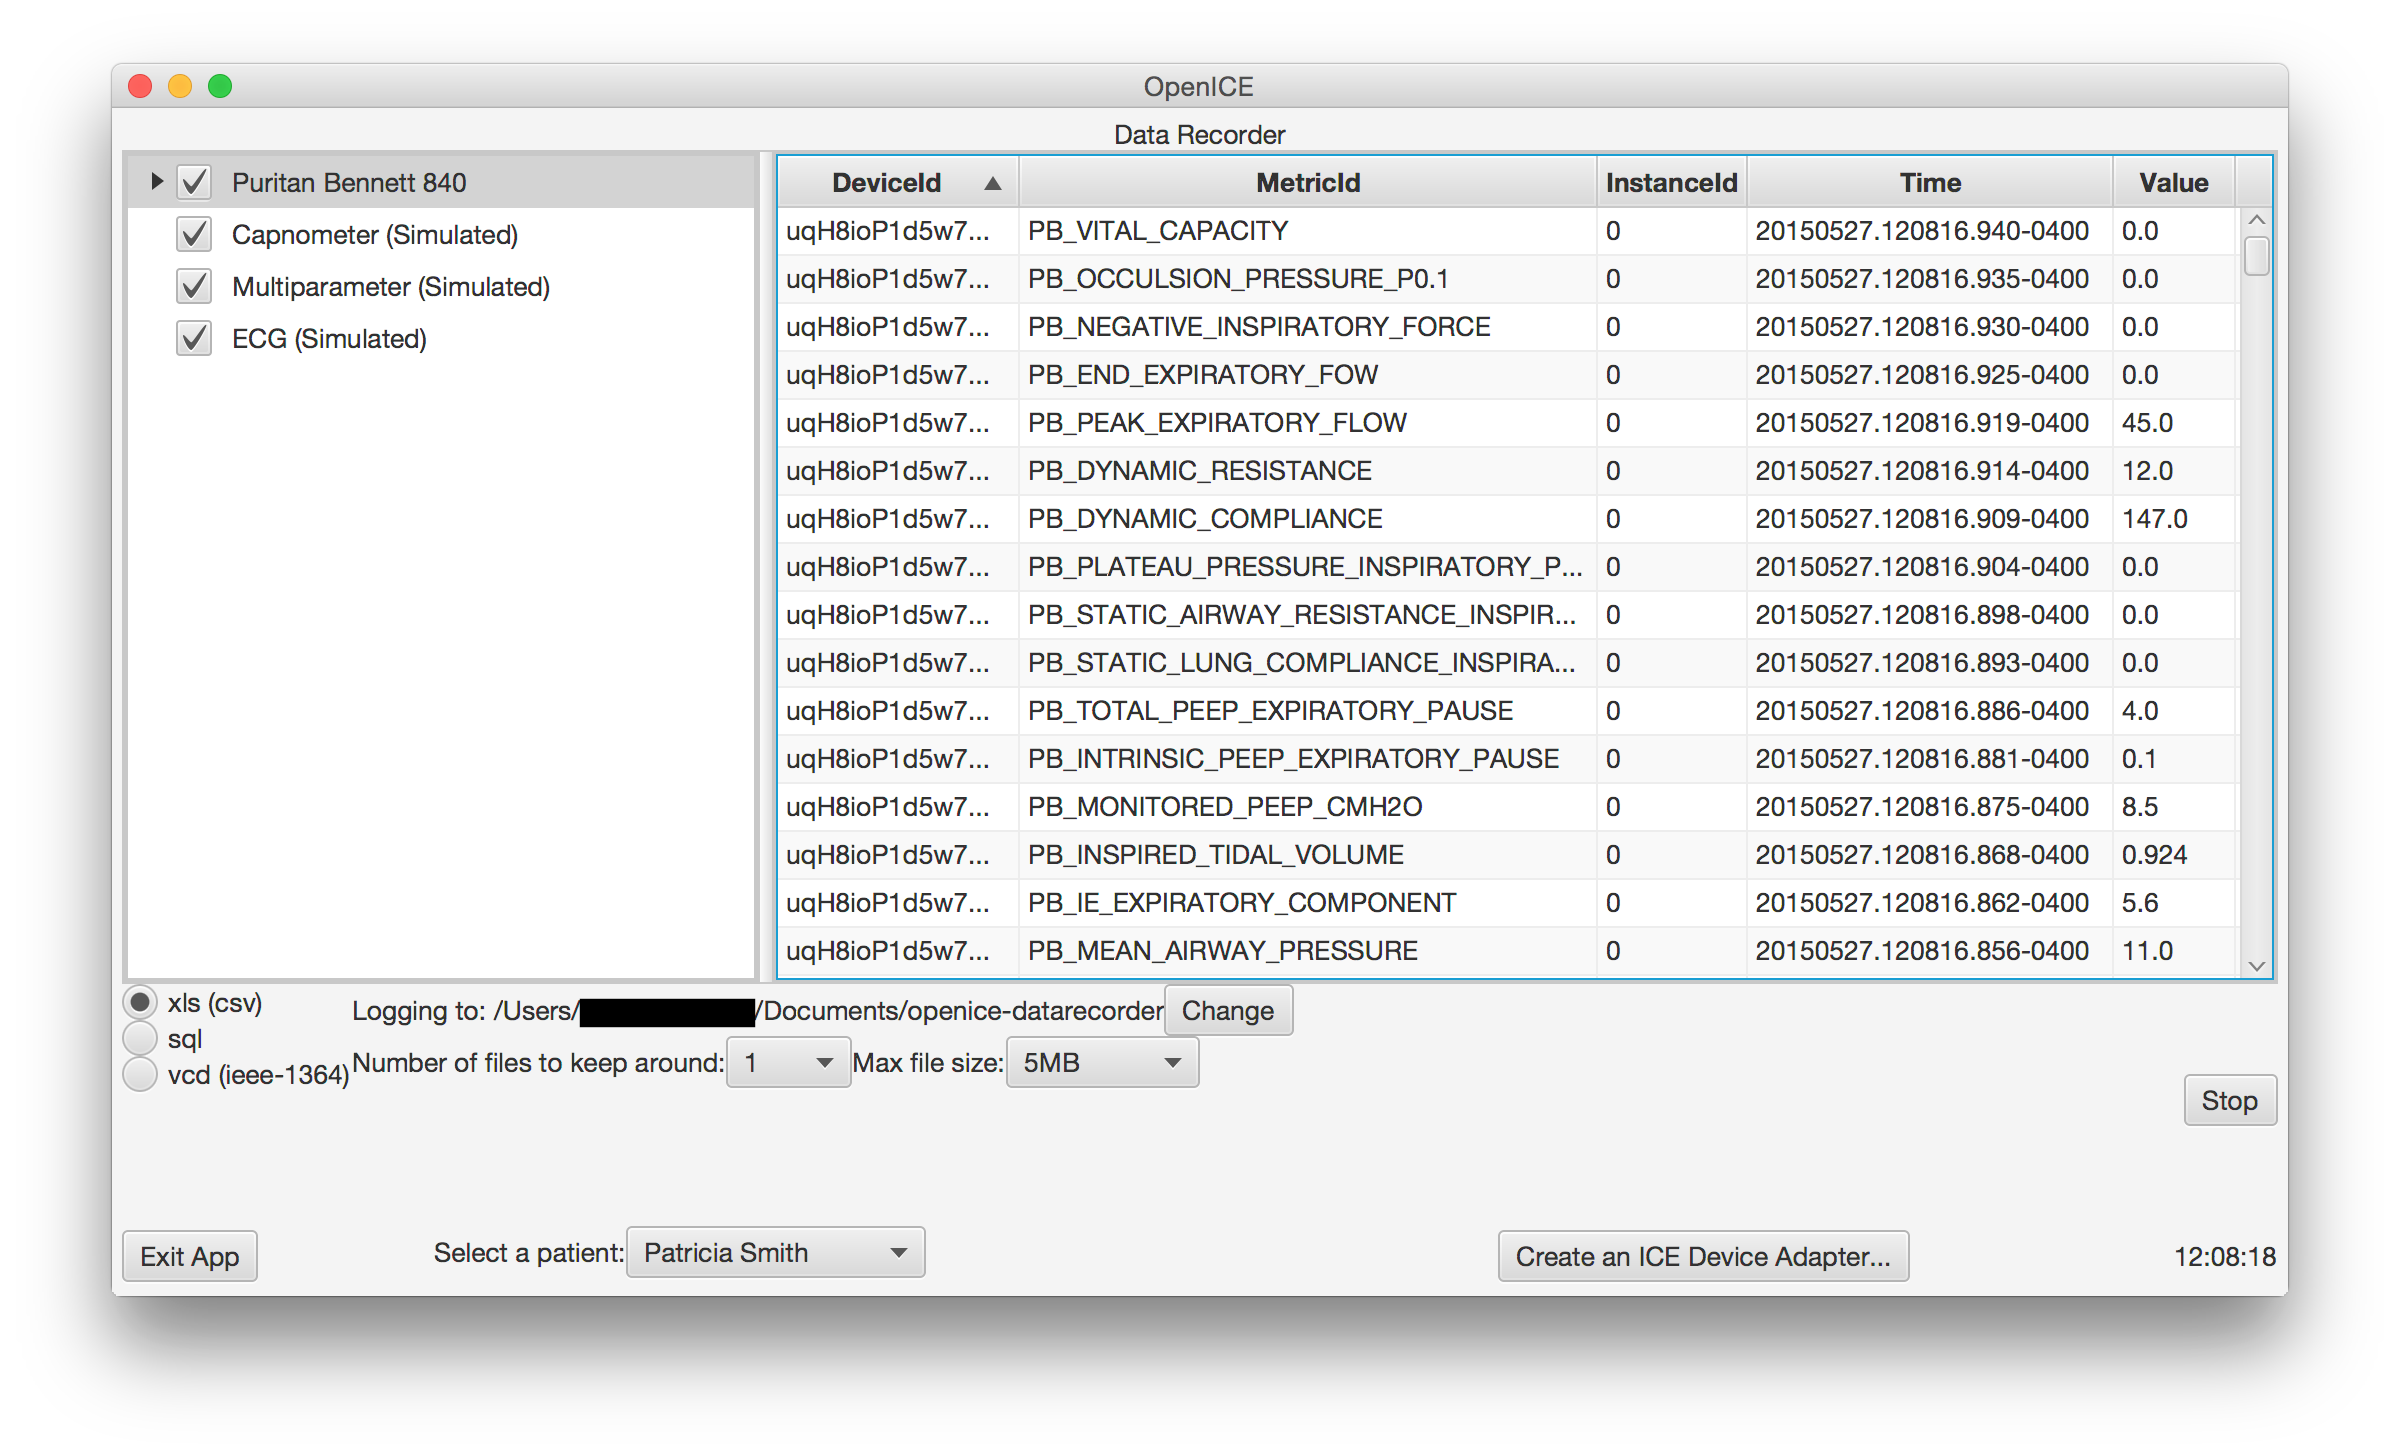
This app records numeric and waveform data in OpenICE. This app enables post hoc data analysis of medical device data. When the app is opened, two large tables will appear. The table on the left will populate with devices connected via a Device Adapter. Select or unselect the checkbox next to the device to choose the specific device data to record data. The table on the right will contain the following five columns:
Select the “Start” button in the bottom right hand corner of the page to begin recording data. Select a location to store the data before clicking the start button. After selecting the start button, the tables will begin to fill with data. The start button will also change to stay "Stop". Select "Stop" when you would like to stop recording and saving the data.
Before starting data collection, select the desired storage location, format and maximum size. Information on data storage is located at the bottom of the app.
To review the data, open the file saved in predetermined location. This data will match the data that appeared in the table in the app.
This app displays selected vital signs for one patient in the form of an arbitrary shape. This allows the user to clearly see all vital signs and whether or not they are in the predetermined normal range. The purpose of this visualization is to illustrate novel methods of information display and exchange. If three vital signs are selected (typically the default) then a triangle will appear (see Examples 1-3 below). If four vital signs are selected, then a square will appear (see Example 4). To add or delete a vital sign from the data visualization app, this vital sign must be added or deleted from the Infusion Safety app (see this section for details).
Each leg of the triangle will represent a different vital sign, and each line has markings with numeric values. The ends of the lines contain numbers outside of the normal range (for example: SpO2 greater than 100 or less than 95), and the middle of the lines contain numbers within the normal range (for example: SpO2 between 95 and 100).
The values that come from devices or physiological monitors are plotted on each line and are connected to one another, creating an inner shape. If there are more than two values for one vital sign, only the highest and the lowest values can be seen. This inner shape is colored based on the status of the vital sign data. To edit the values for when the inner shape will be green, yellow, or red, go to the Infusion Safety app section for more information.
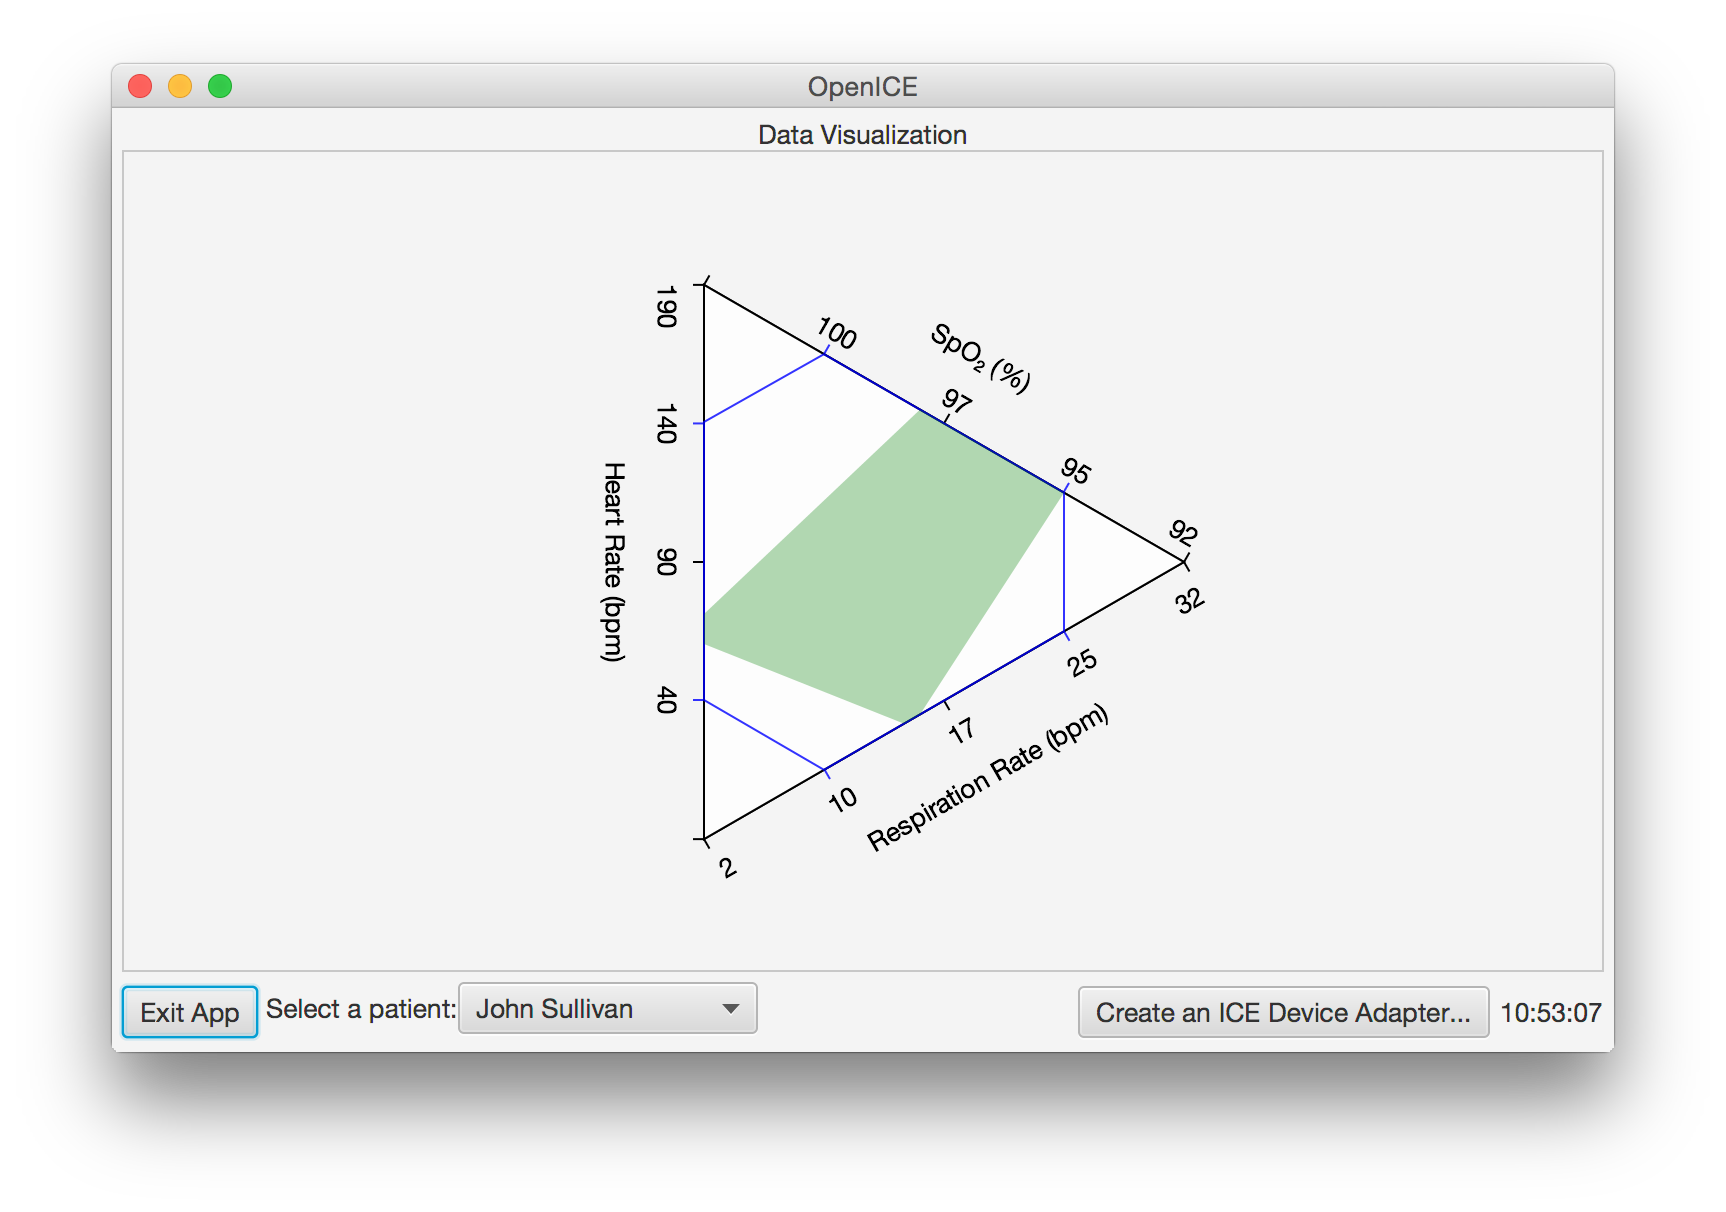
Example 1
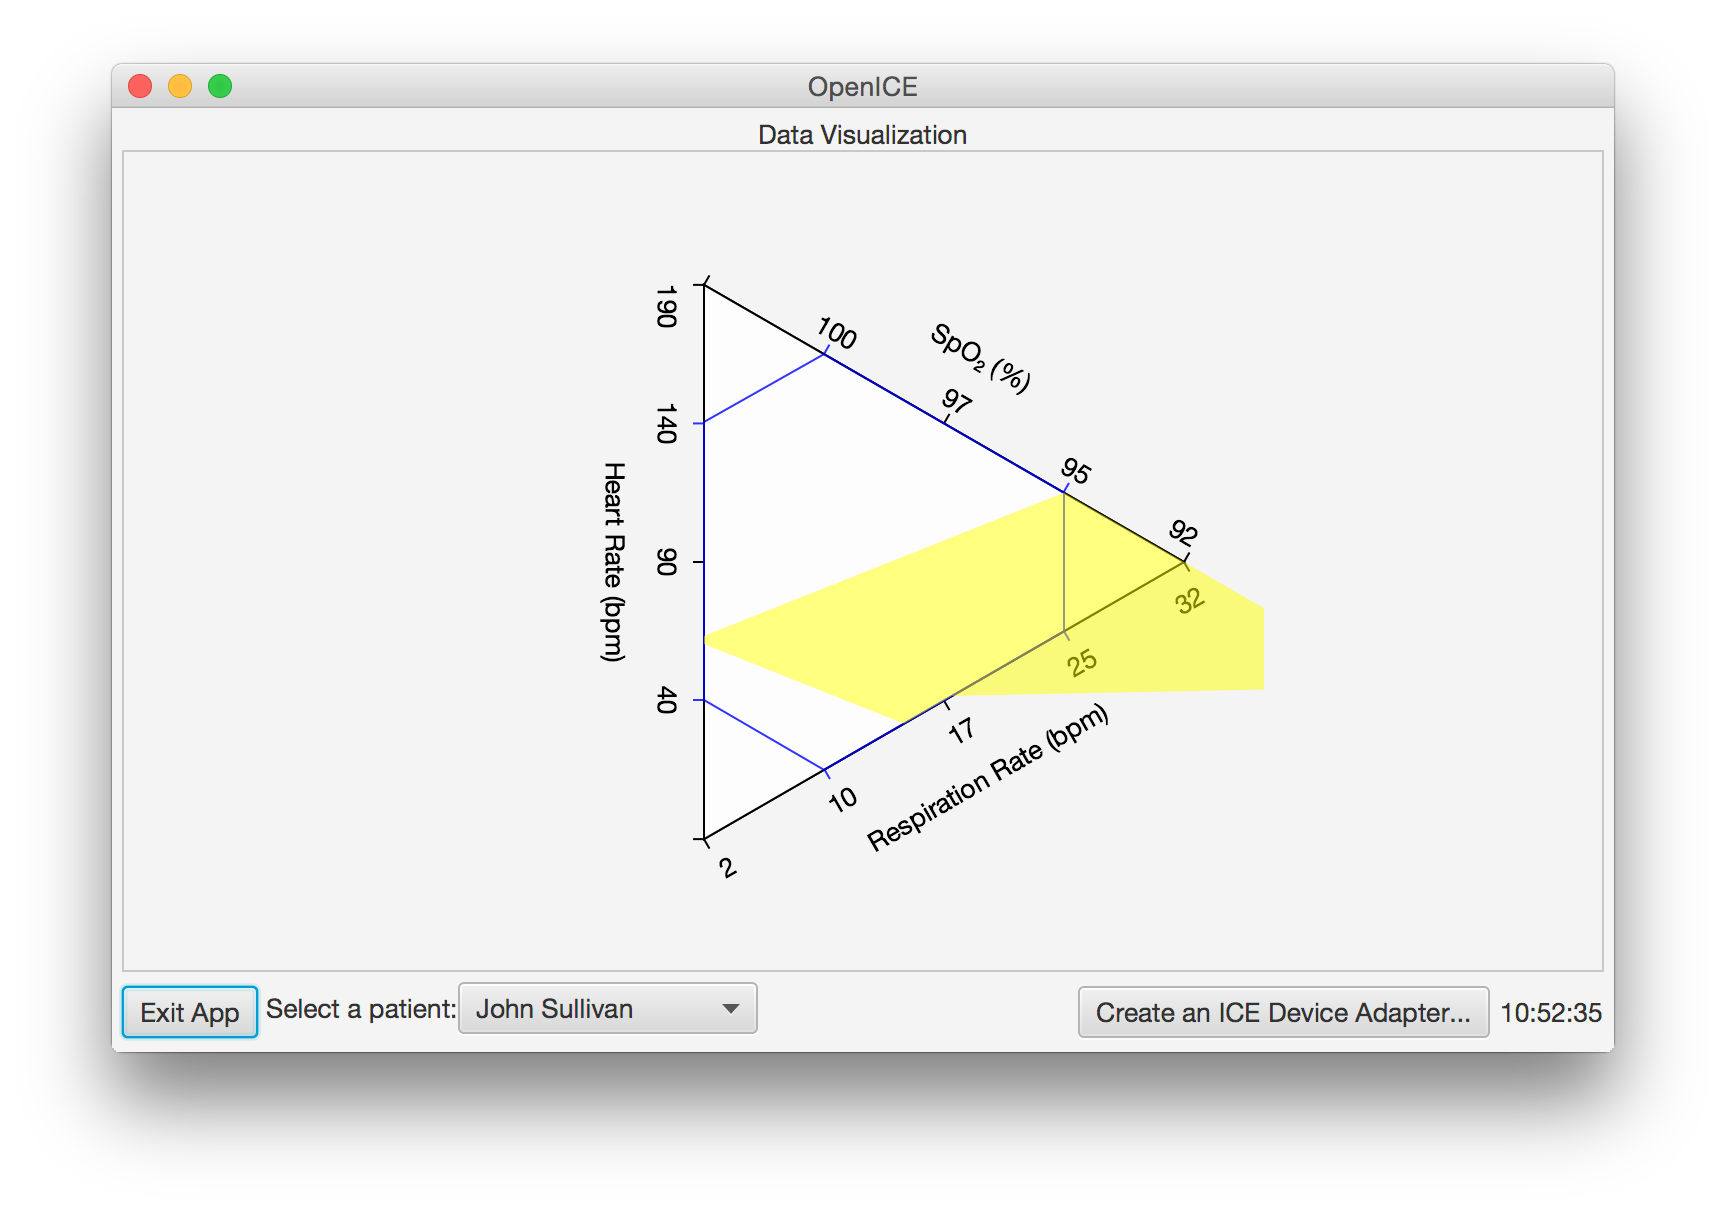
Example 2
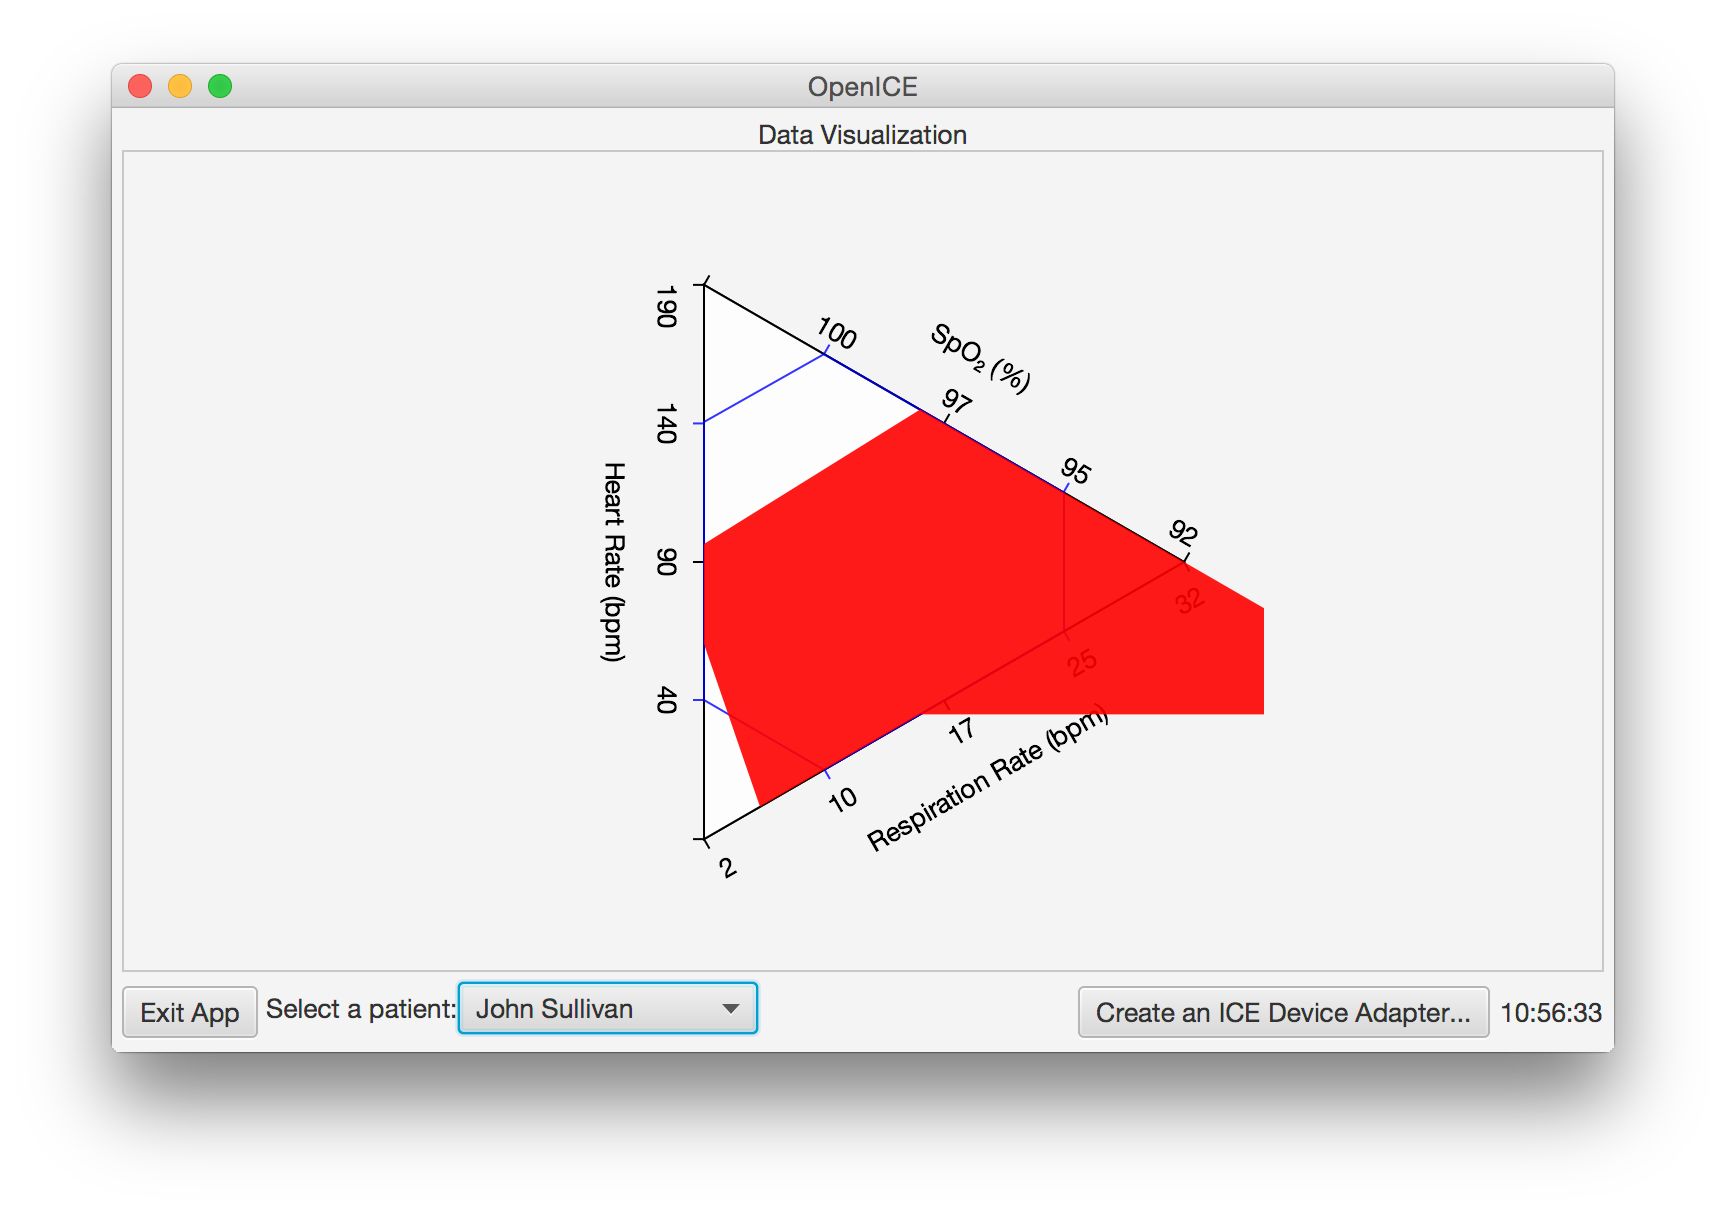
Example 3
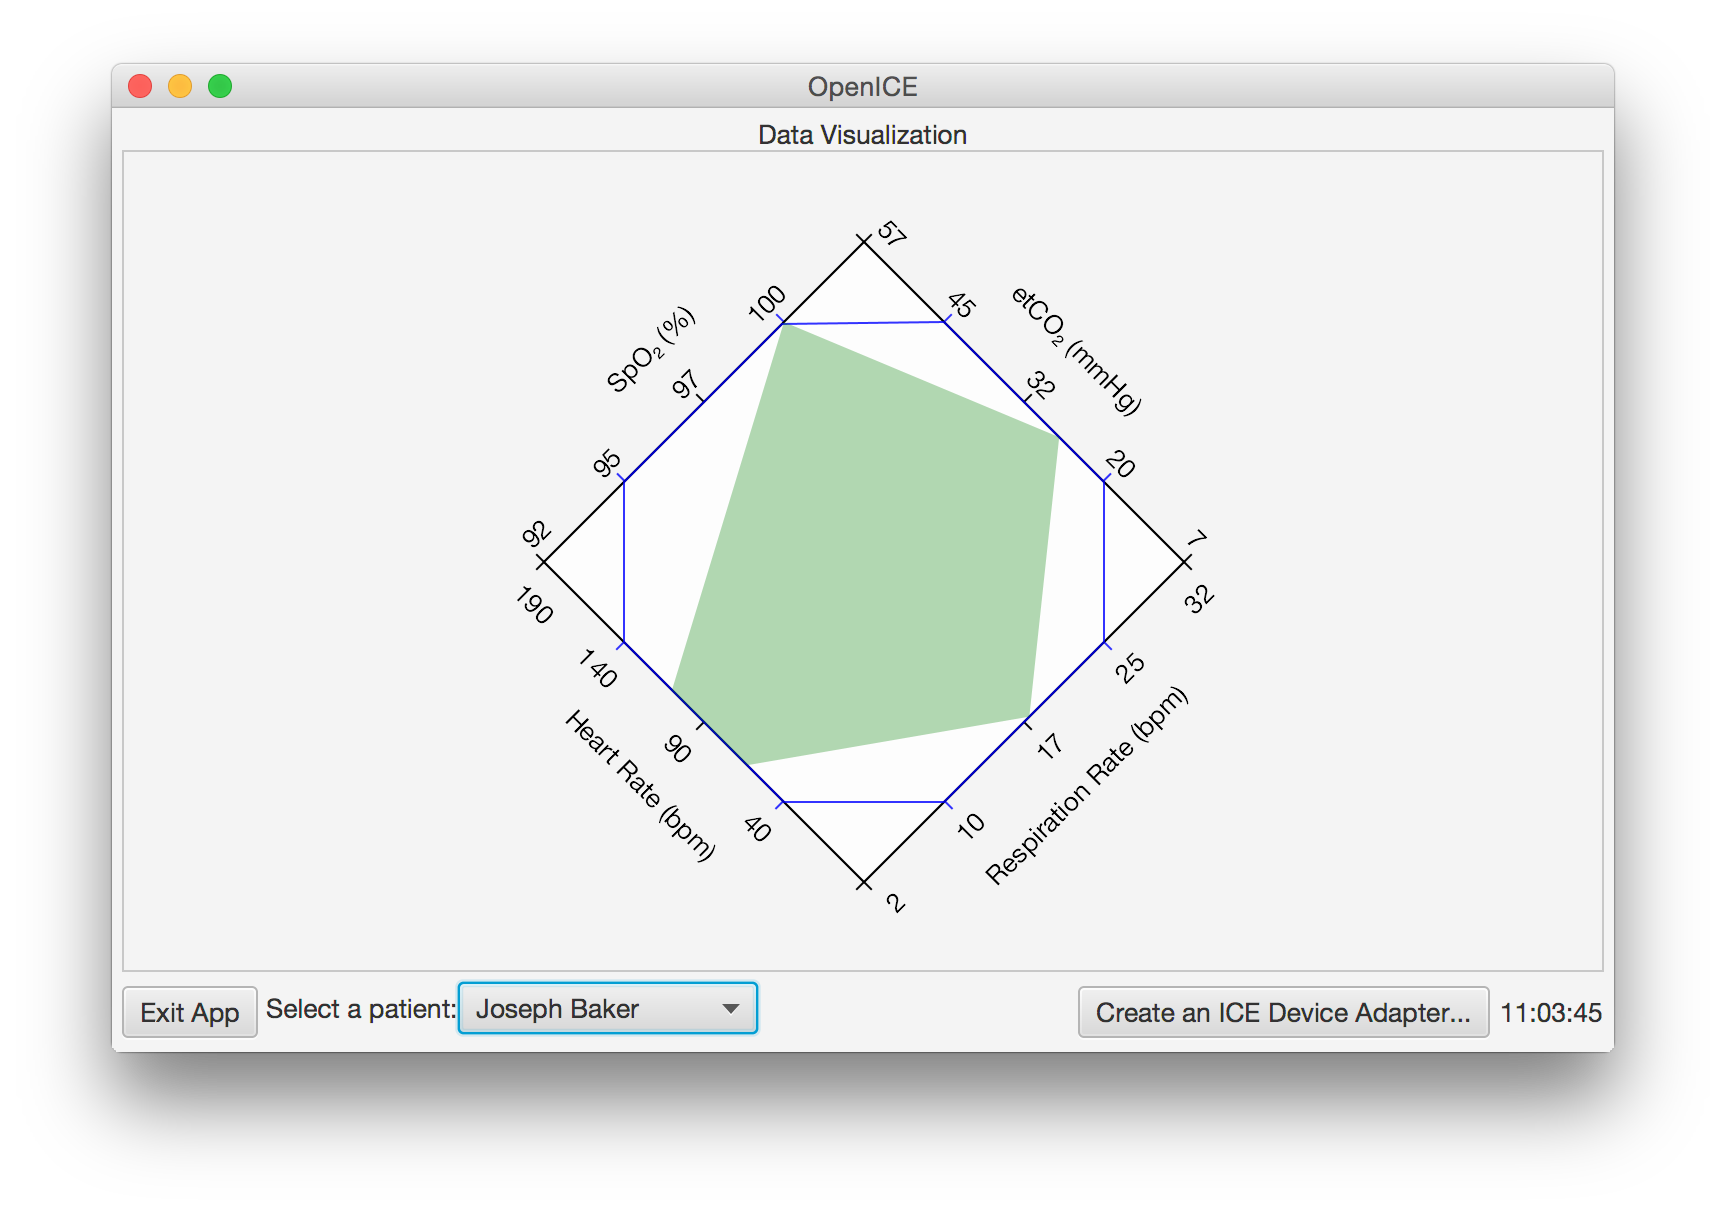
Example 4
This application exports data to Health Level Seven International (HL7). HL7 is an American National Standards Institute (ANSI)-accredited standards development organization dedicated to providing a comprehensive framework and related standards for the exchange, integration, sharing, and retrieval of electronic health information that supports clinical practice and the management, delivery and evaluation of health services. (1)
The most common purpose of medical device integration in the world today is for data entry into an EMR or other documentation application platform via HL7 messaging. This app is a demonstration of the ease of implementation of an HL7 connection when using the OpenICE network. The demo application will send numeric data from devices in the current patient context to a user entered address. The destination used in the lab is the HAPI FHIR test server at fhir.openice.info.
HL7 Export properties are configurable at the bottom of the screen.
One of the flagship use cases for closed loop control of medical devices is the safe delivery of patient controlled analgesia (PCA). This app is a prototype implementation of the proposed closed loop safety system. The application controls the administration of IV medication and is programmed to stop the pump if the algorithm believes the patient is in a non-normal state. The algorithm for stopping the pump is customizable, but by default will stop the infusion if any of the connected devices is in a red alarm state or if two of the devices are in a yellow alarm state. The thresholds for red and yellow alarms are adjustable by dragging the associated slider.
When this app is opened, four text boxes will appear at the top of the screen.
A row for each vital sign will appear in the app. Respiration Rate, Heart Rate, and SpO2 will are present by default. Devices and the associated vital sign measurement will appear on the right. A colored bar will also appear below the name of the vital sign. The data range for each color can be changed by moving the buttons left and right on the colored bar.
The “Configuration Mode” is available to make edits to the app [listed below]. Check the configuration mode checkbox to view the edits available for this app. See Example 4.
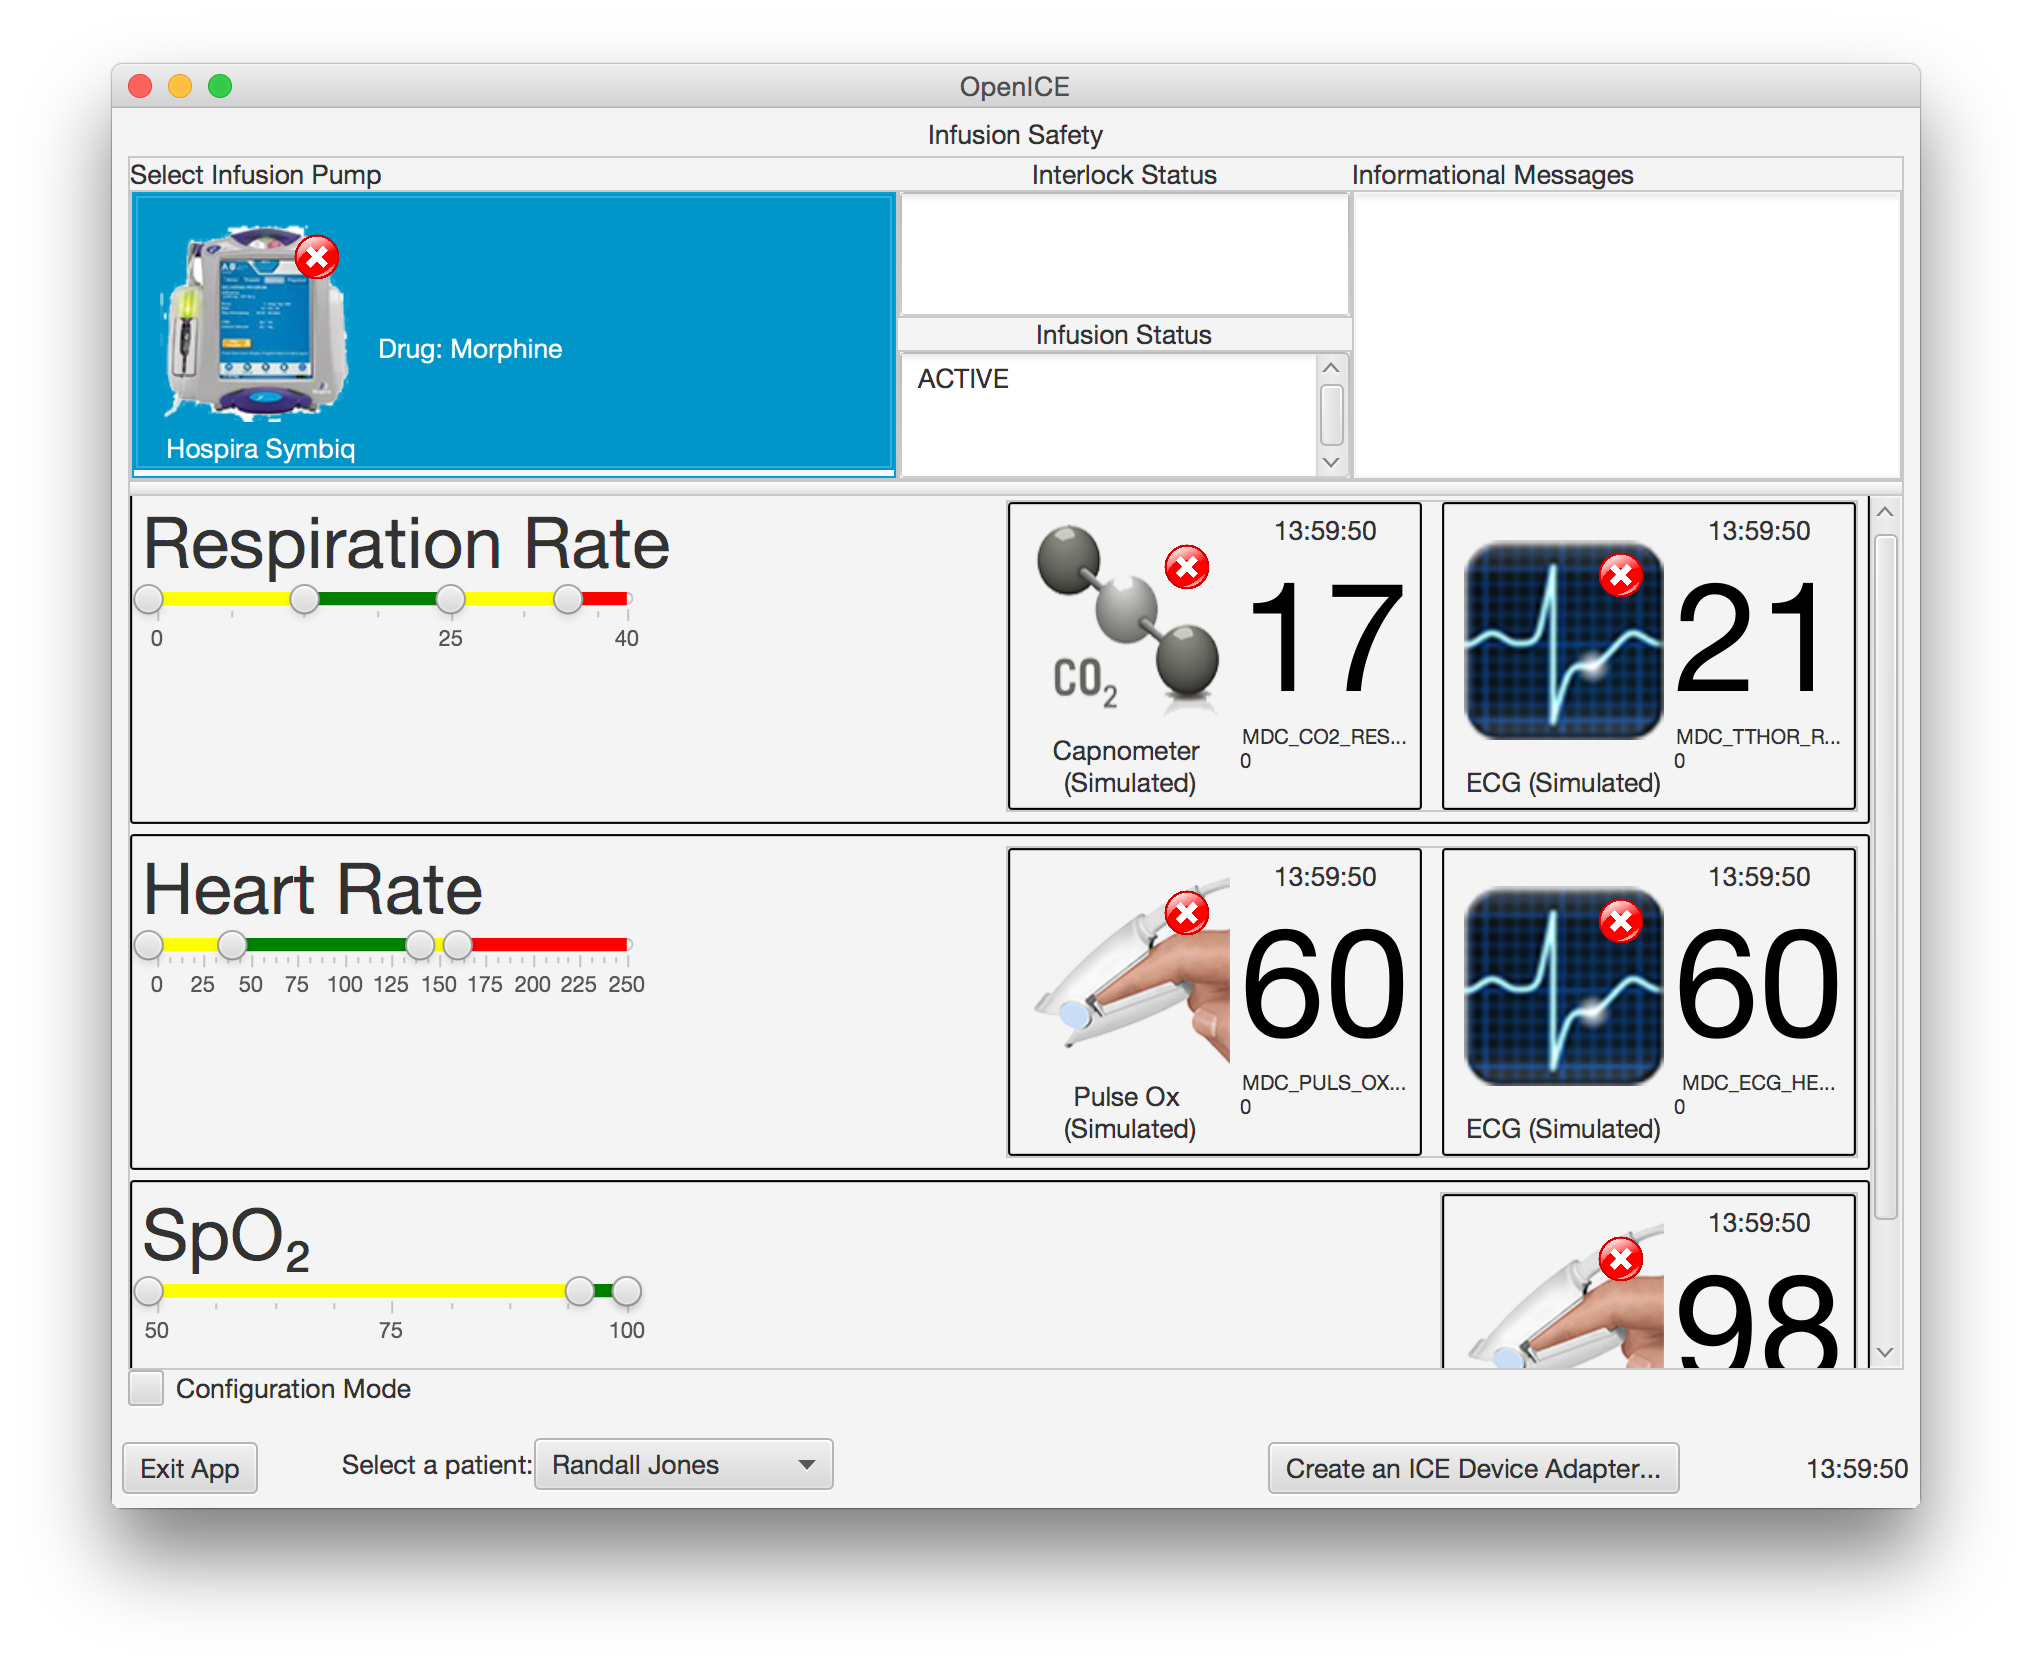
Example 1
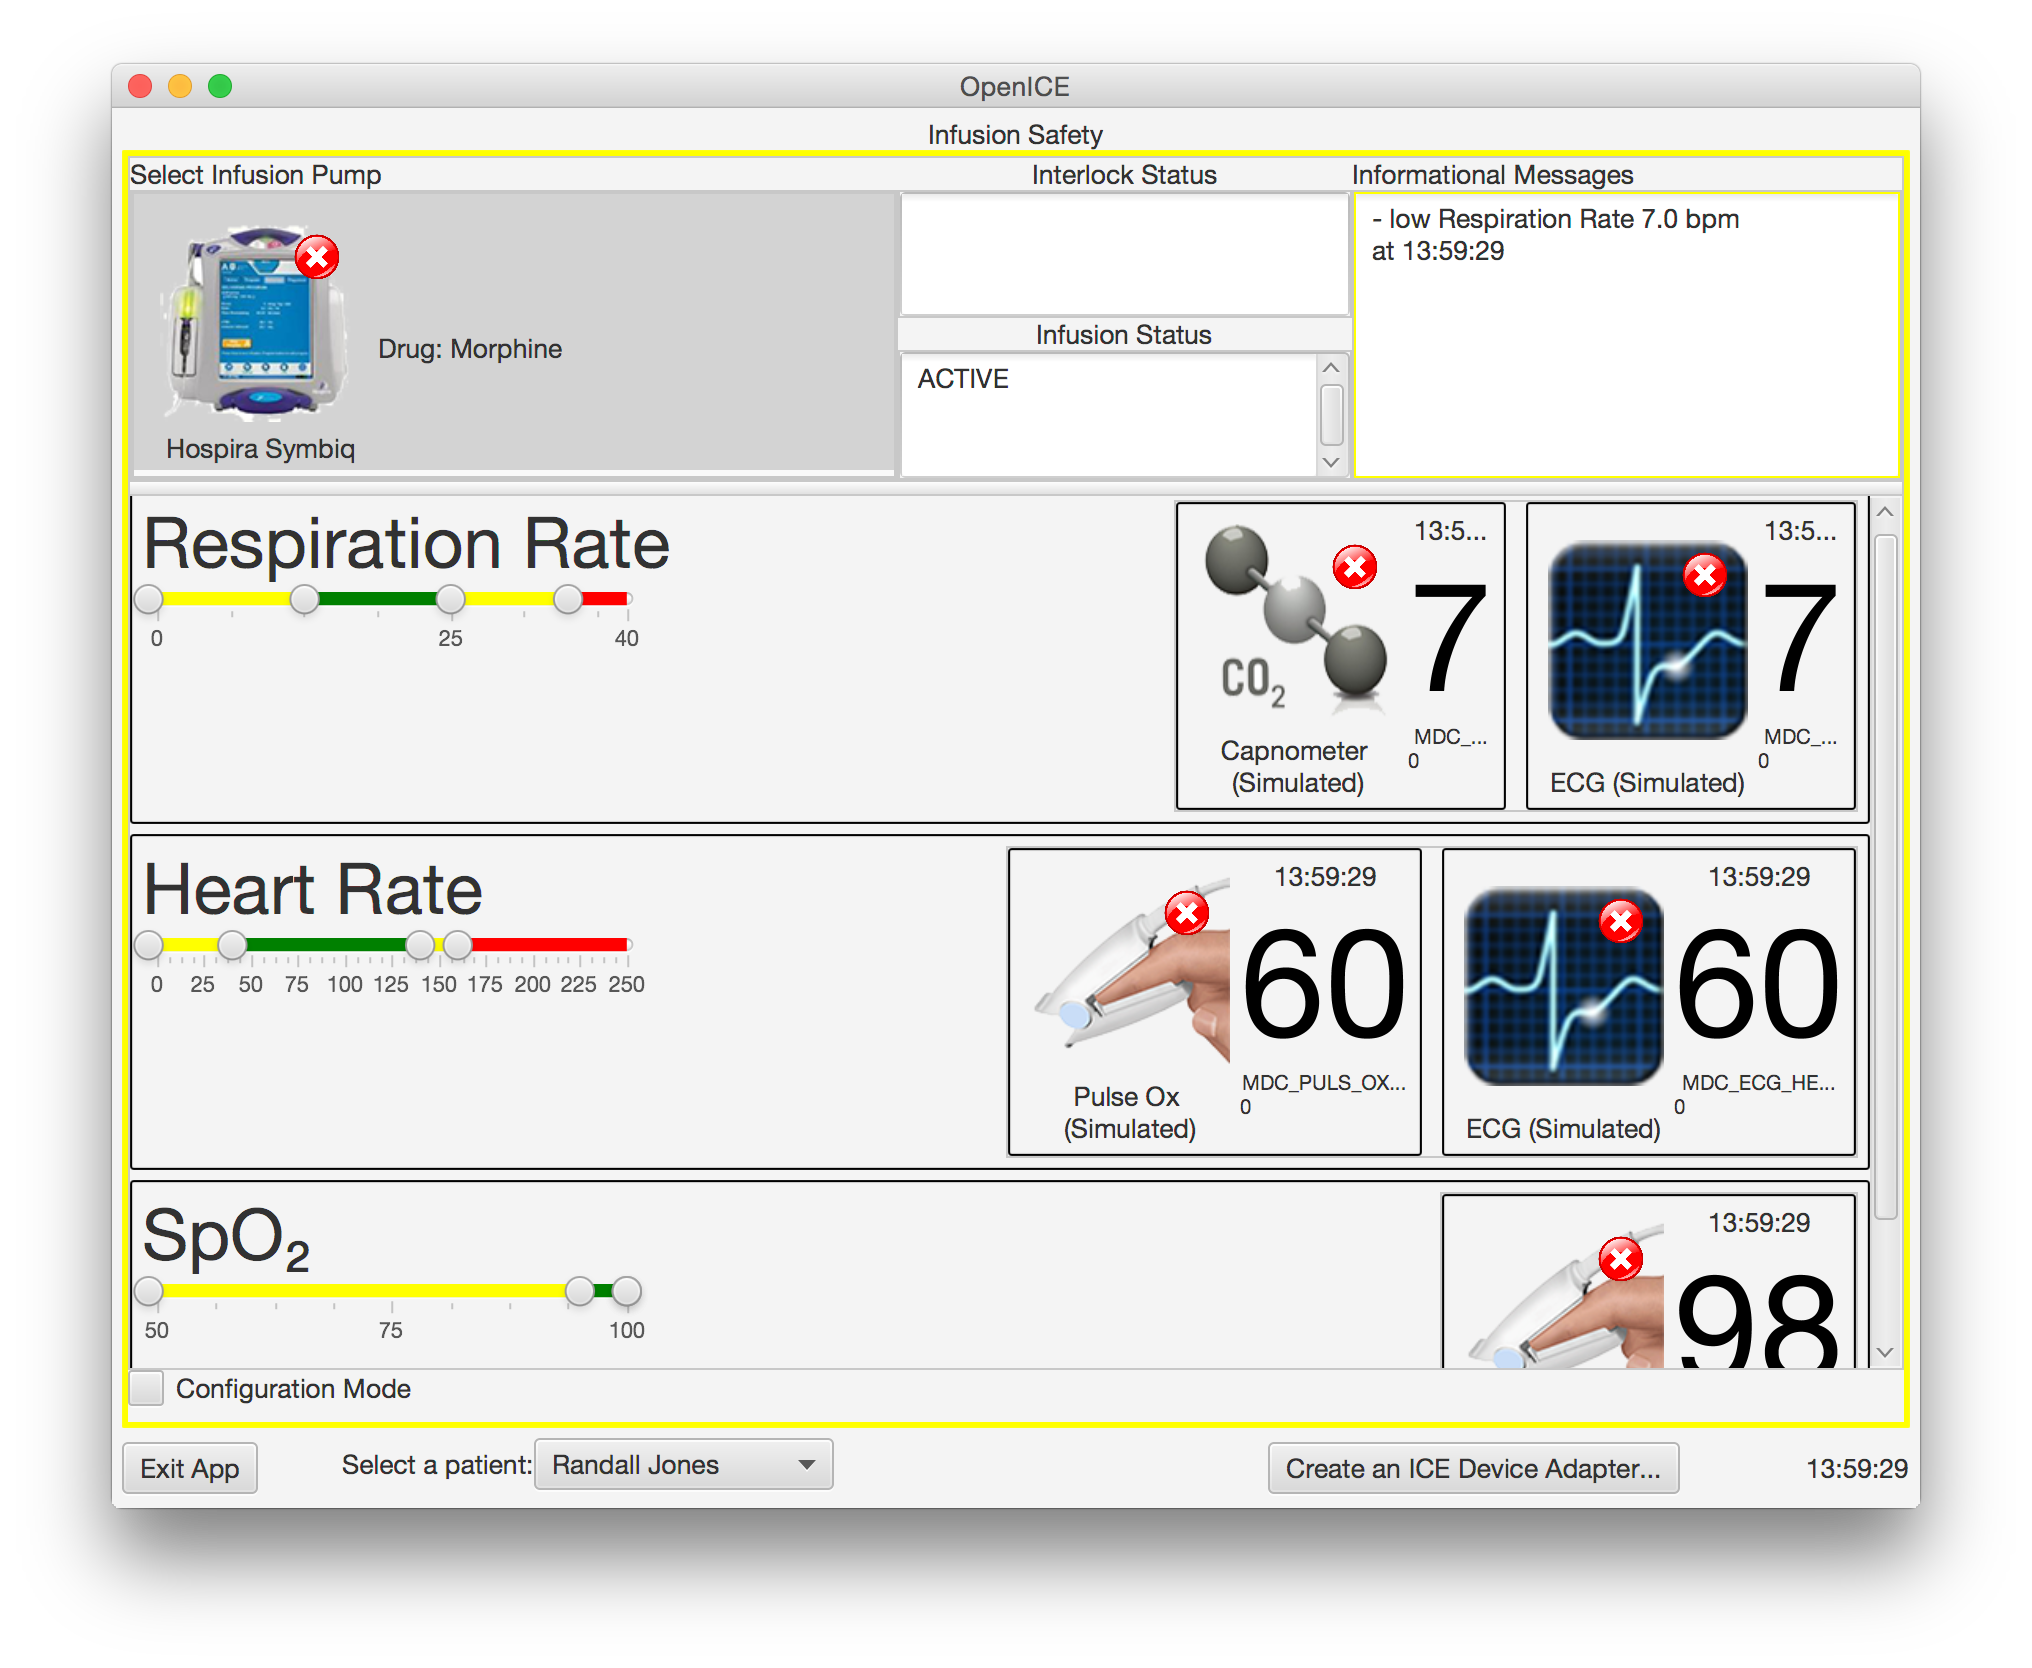
Example 2
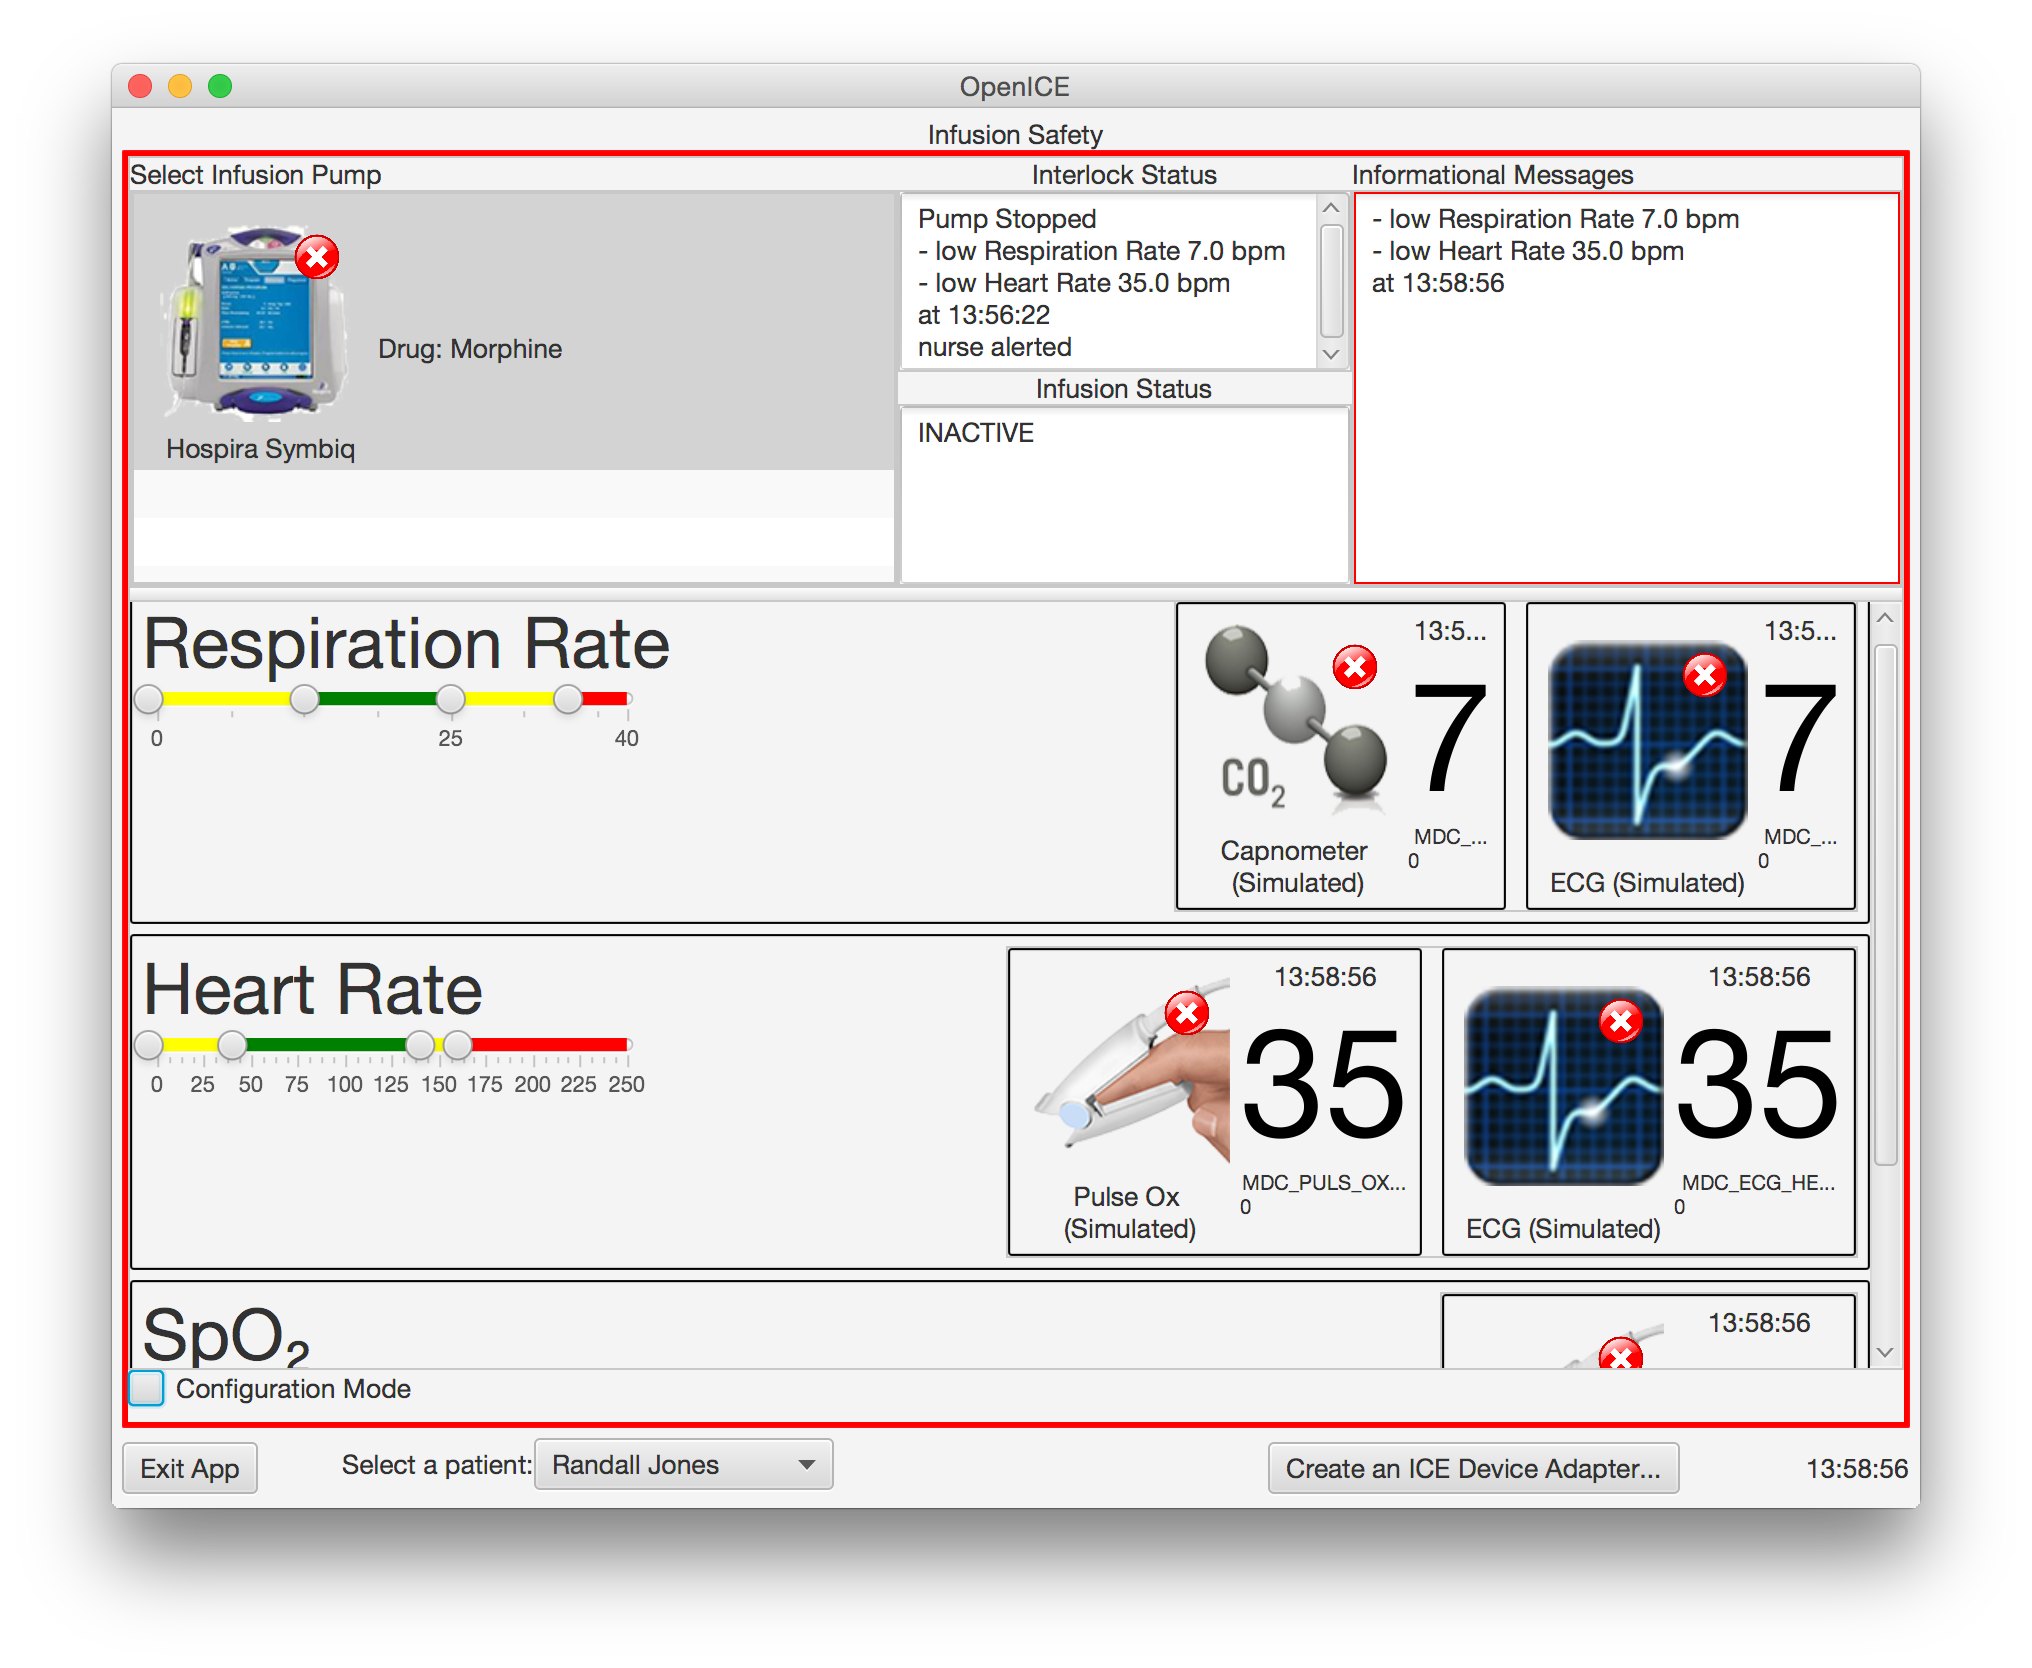
Example 3
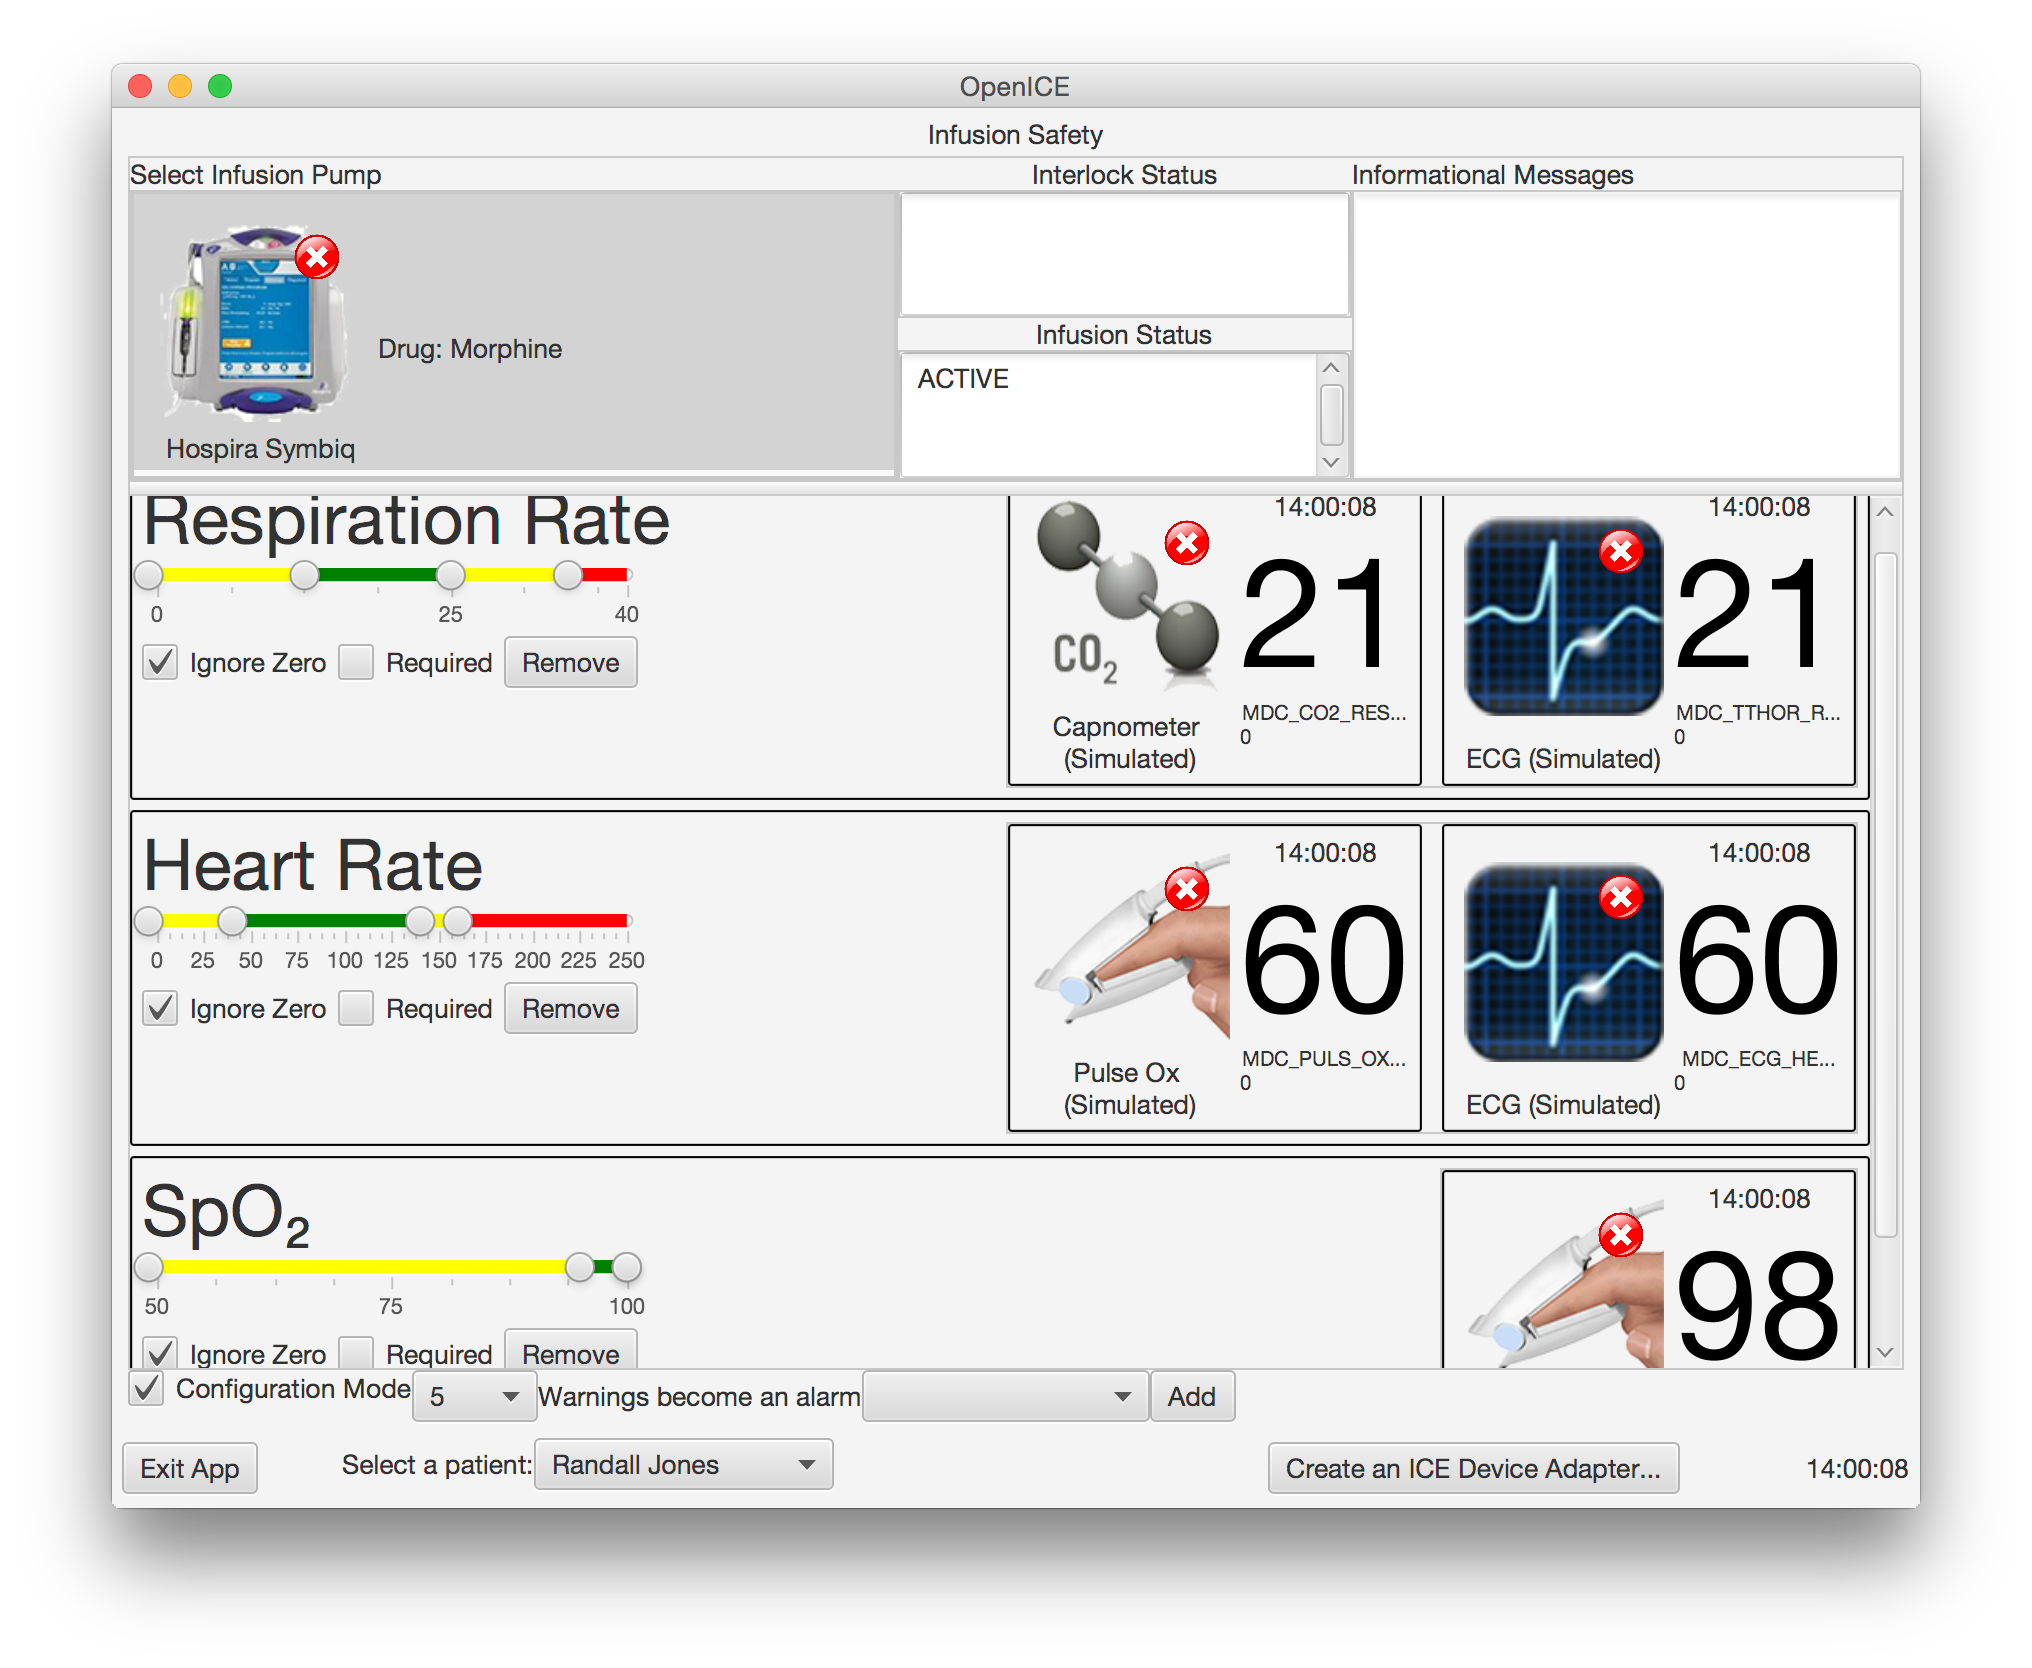
Example 4
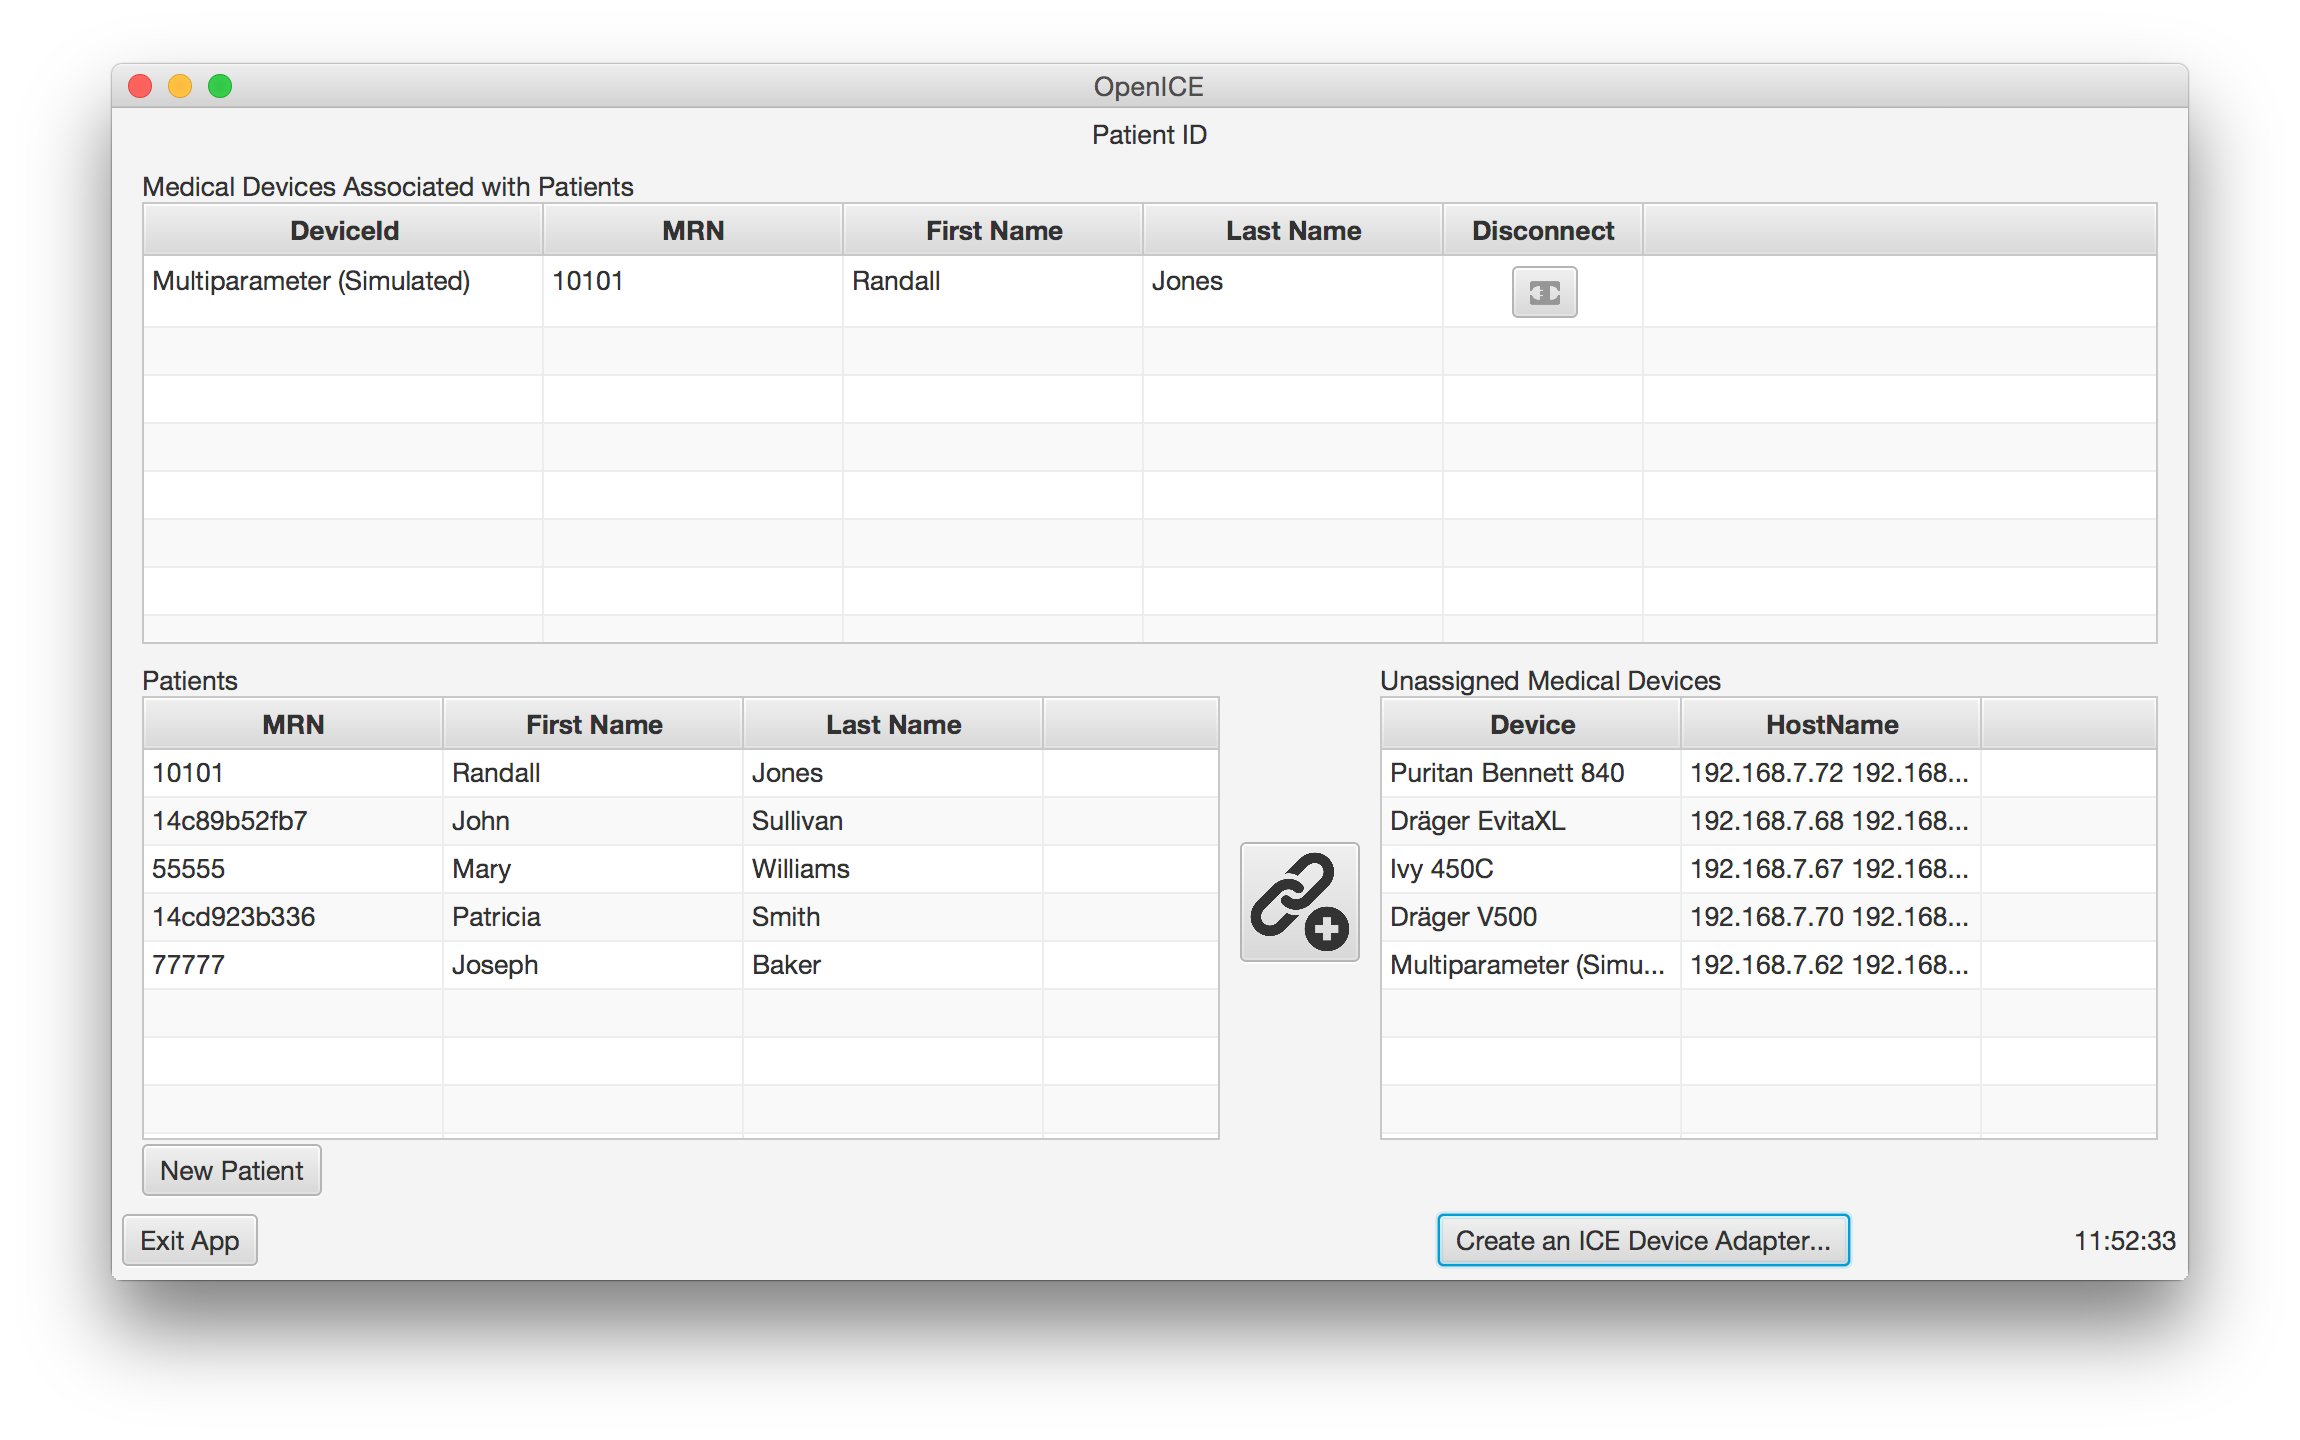
This application helps manage patient to device associations. These associations, or connections, establish a patient context. This patient context is what all other apps operate within. Patients are connected and disconnected from devices using this app. This connection will remain when using other apps.
The table in the top center shows the current patient-device connections. To make a connection first select a patient in the bottom left table. Then select a device in the bottom right table. (Each selection will appear highlighted.) To make the connection, select the link button in between these two tables. This connection will then show in the top table. To disconnect the patient from the device, click the button in the disconnect column on the top table. Once this has been done, the device will move back to the unassigned table on the bottom right side of the page.
To add a new patient to use in the OpenICE apps, click the button “Create new MRN entry”. A window will pop up to add a new patient. This window will give the following fields:
The patients entered on this app will be saved to one of two places. If the Supervisor was started with a FHIR server address entered, the data will be saved to that server using HL7 FHIR. If the address was left blank, the patients will be saved to a local database and deleted when the Supervisor is closed.
The OpenICE platform is highly flexible in it's distribution of data. The output of calculations completed remotely can be re-entered into the network to be consumed by other application or devices. Examples of data outputs that could be used as an input into another system are clinical decision support or digital signal processing. This application takes the respiratory waveform from a device in the OpenICE network, computes a custom respiratory rate from the waveform with a user selected averaging time, and publishes this new calculation back to the system to be used by other applications like the infusion safety app.
Click on a device on the top left of the screen and it's output respiratory waveform will appear below it, as seen in example 1. A newly calculated respiratory rate will appear next to the waveform. The averaging time for this newly calculated respiratory rate is configurable on the right side of the screen by moving the slider between 0 and 100 seconds. If you would like to publish this value back to the system, select the checkbox next to "Create Device". The new calculation is shown in example 2.
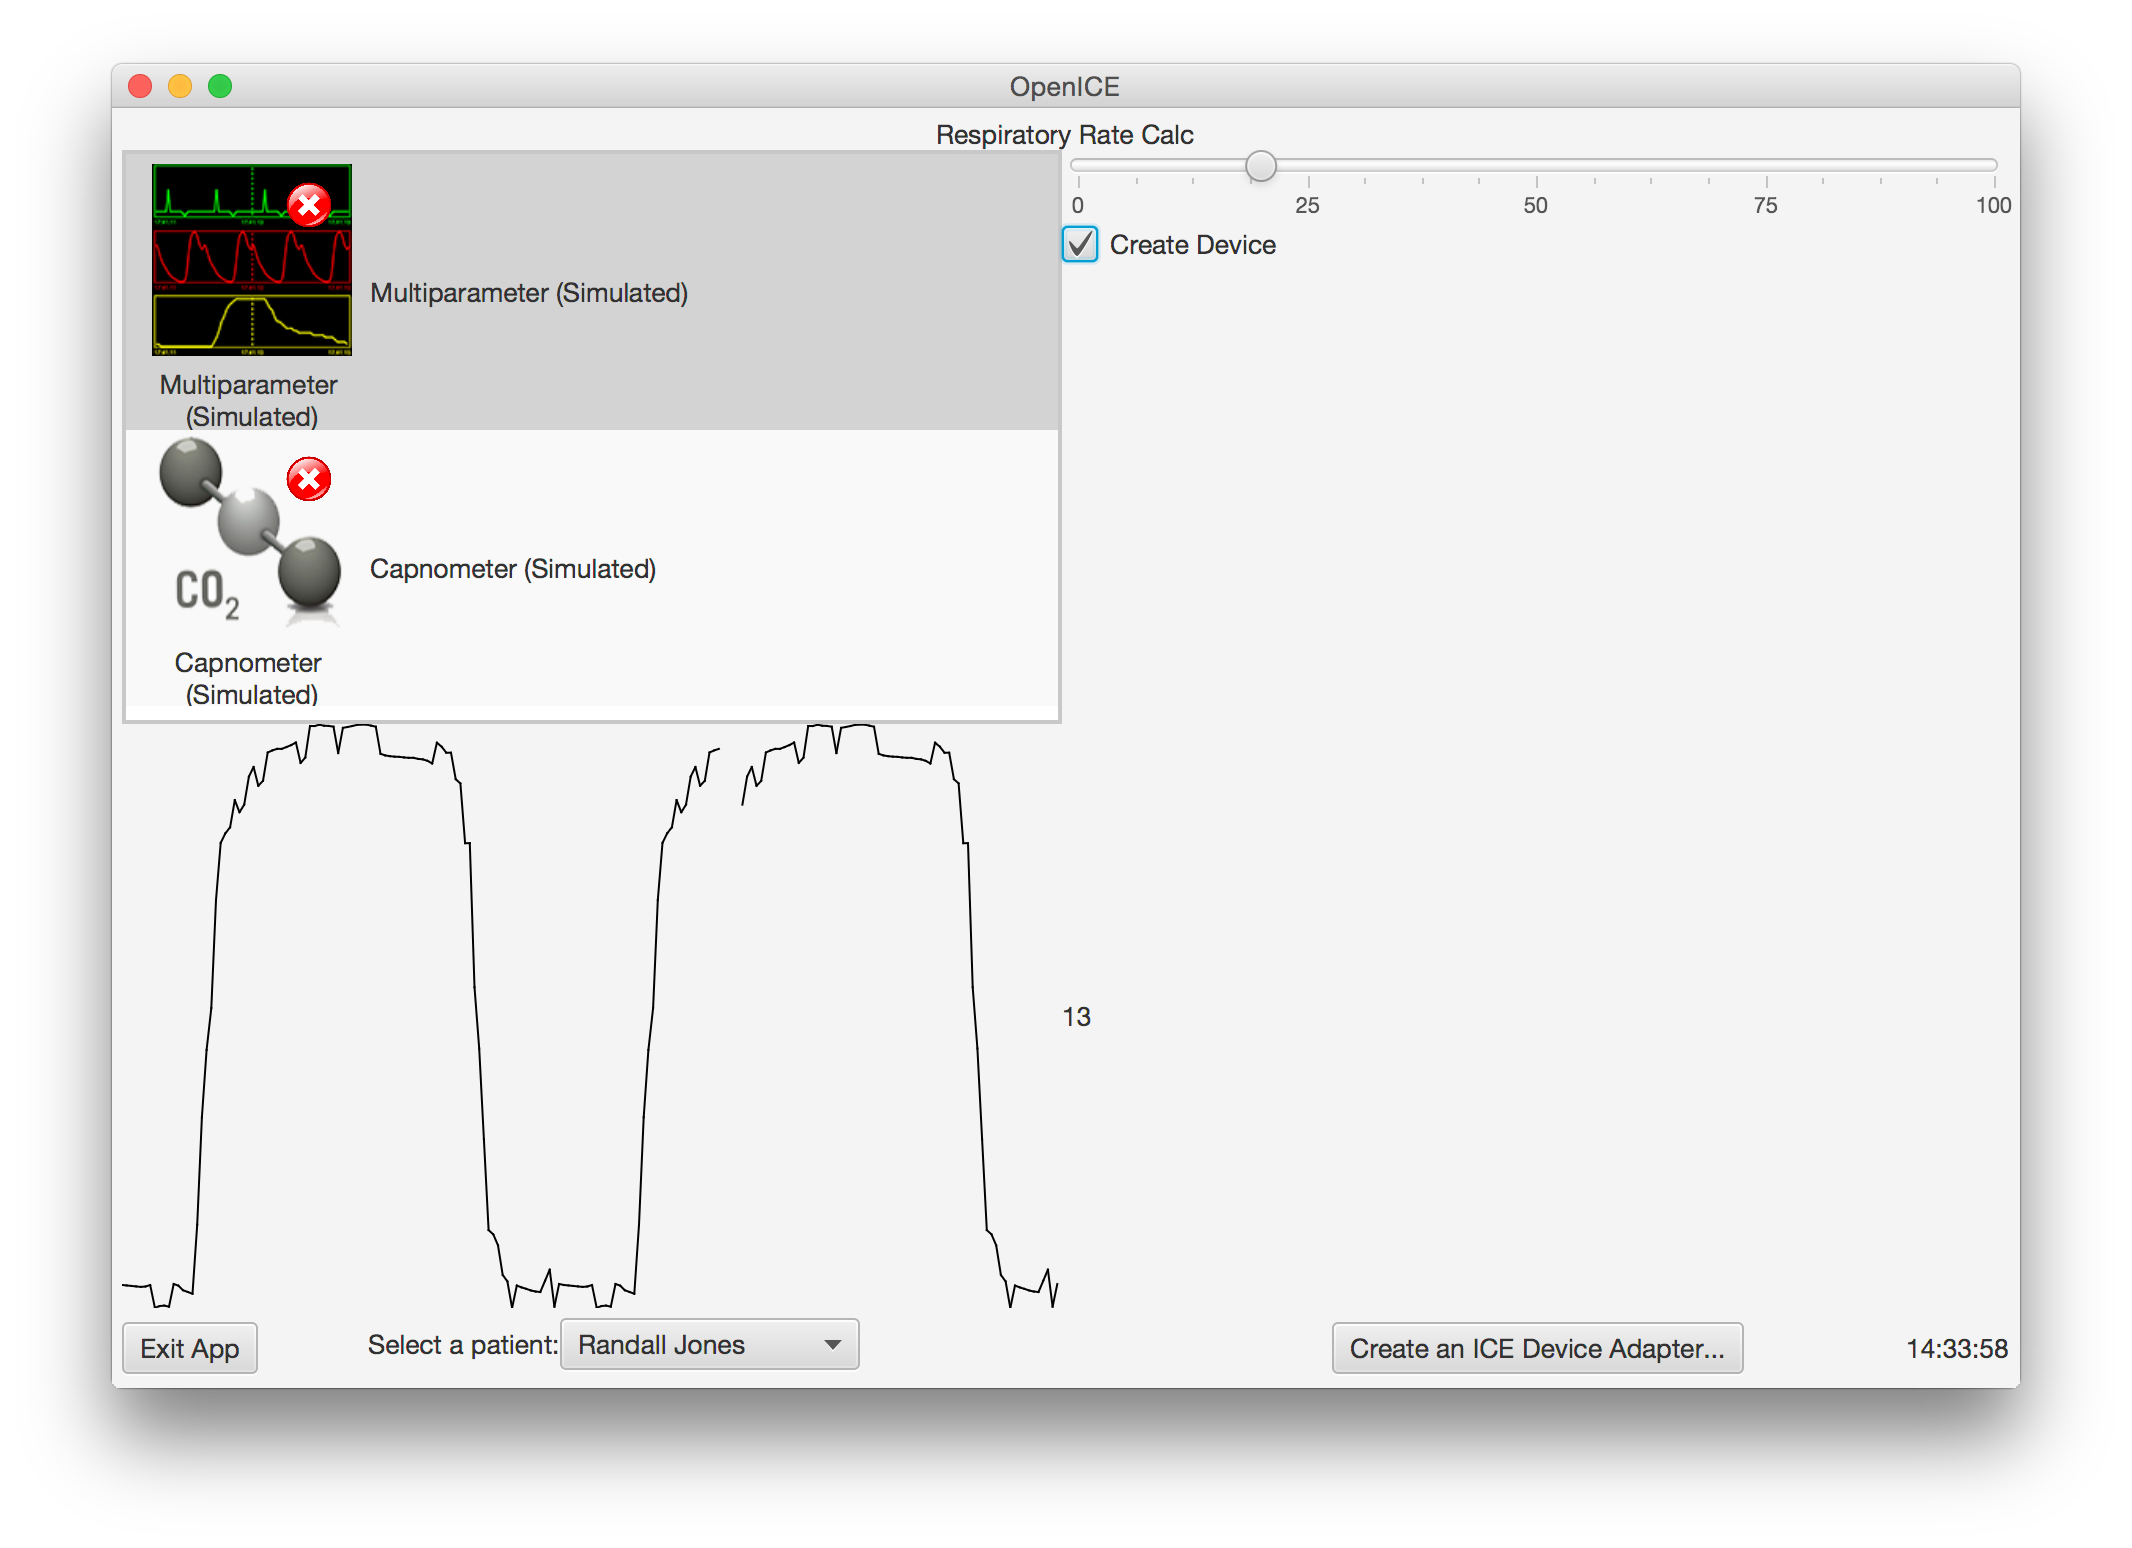
Example 1
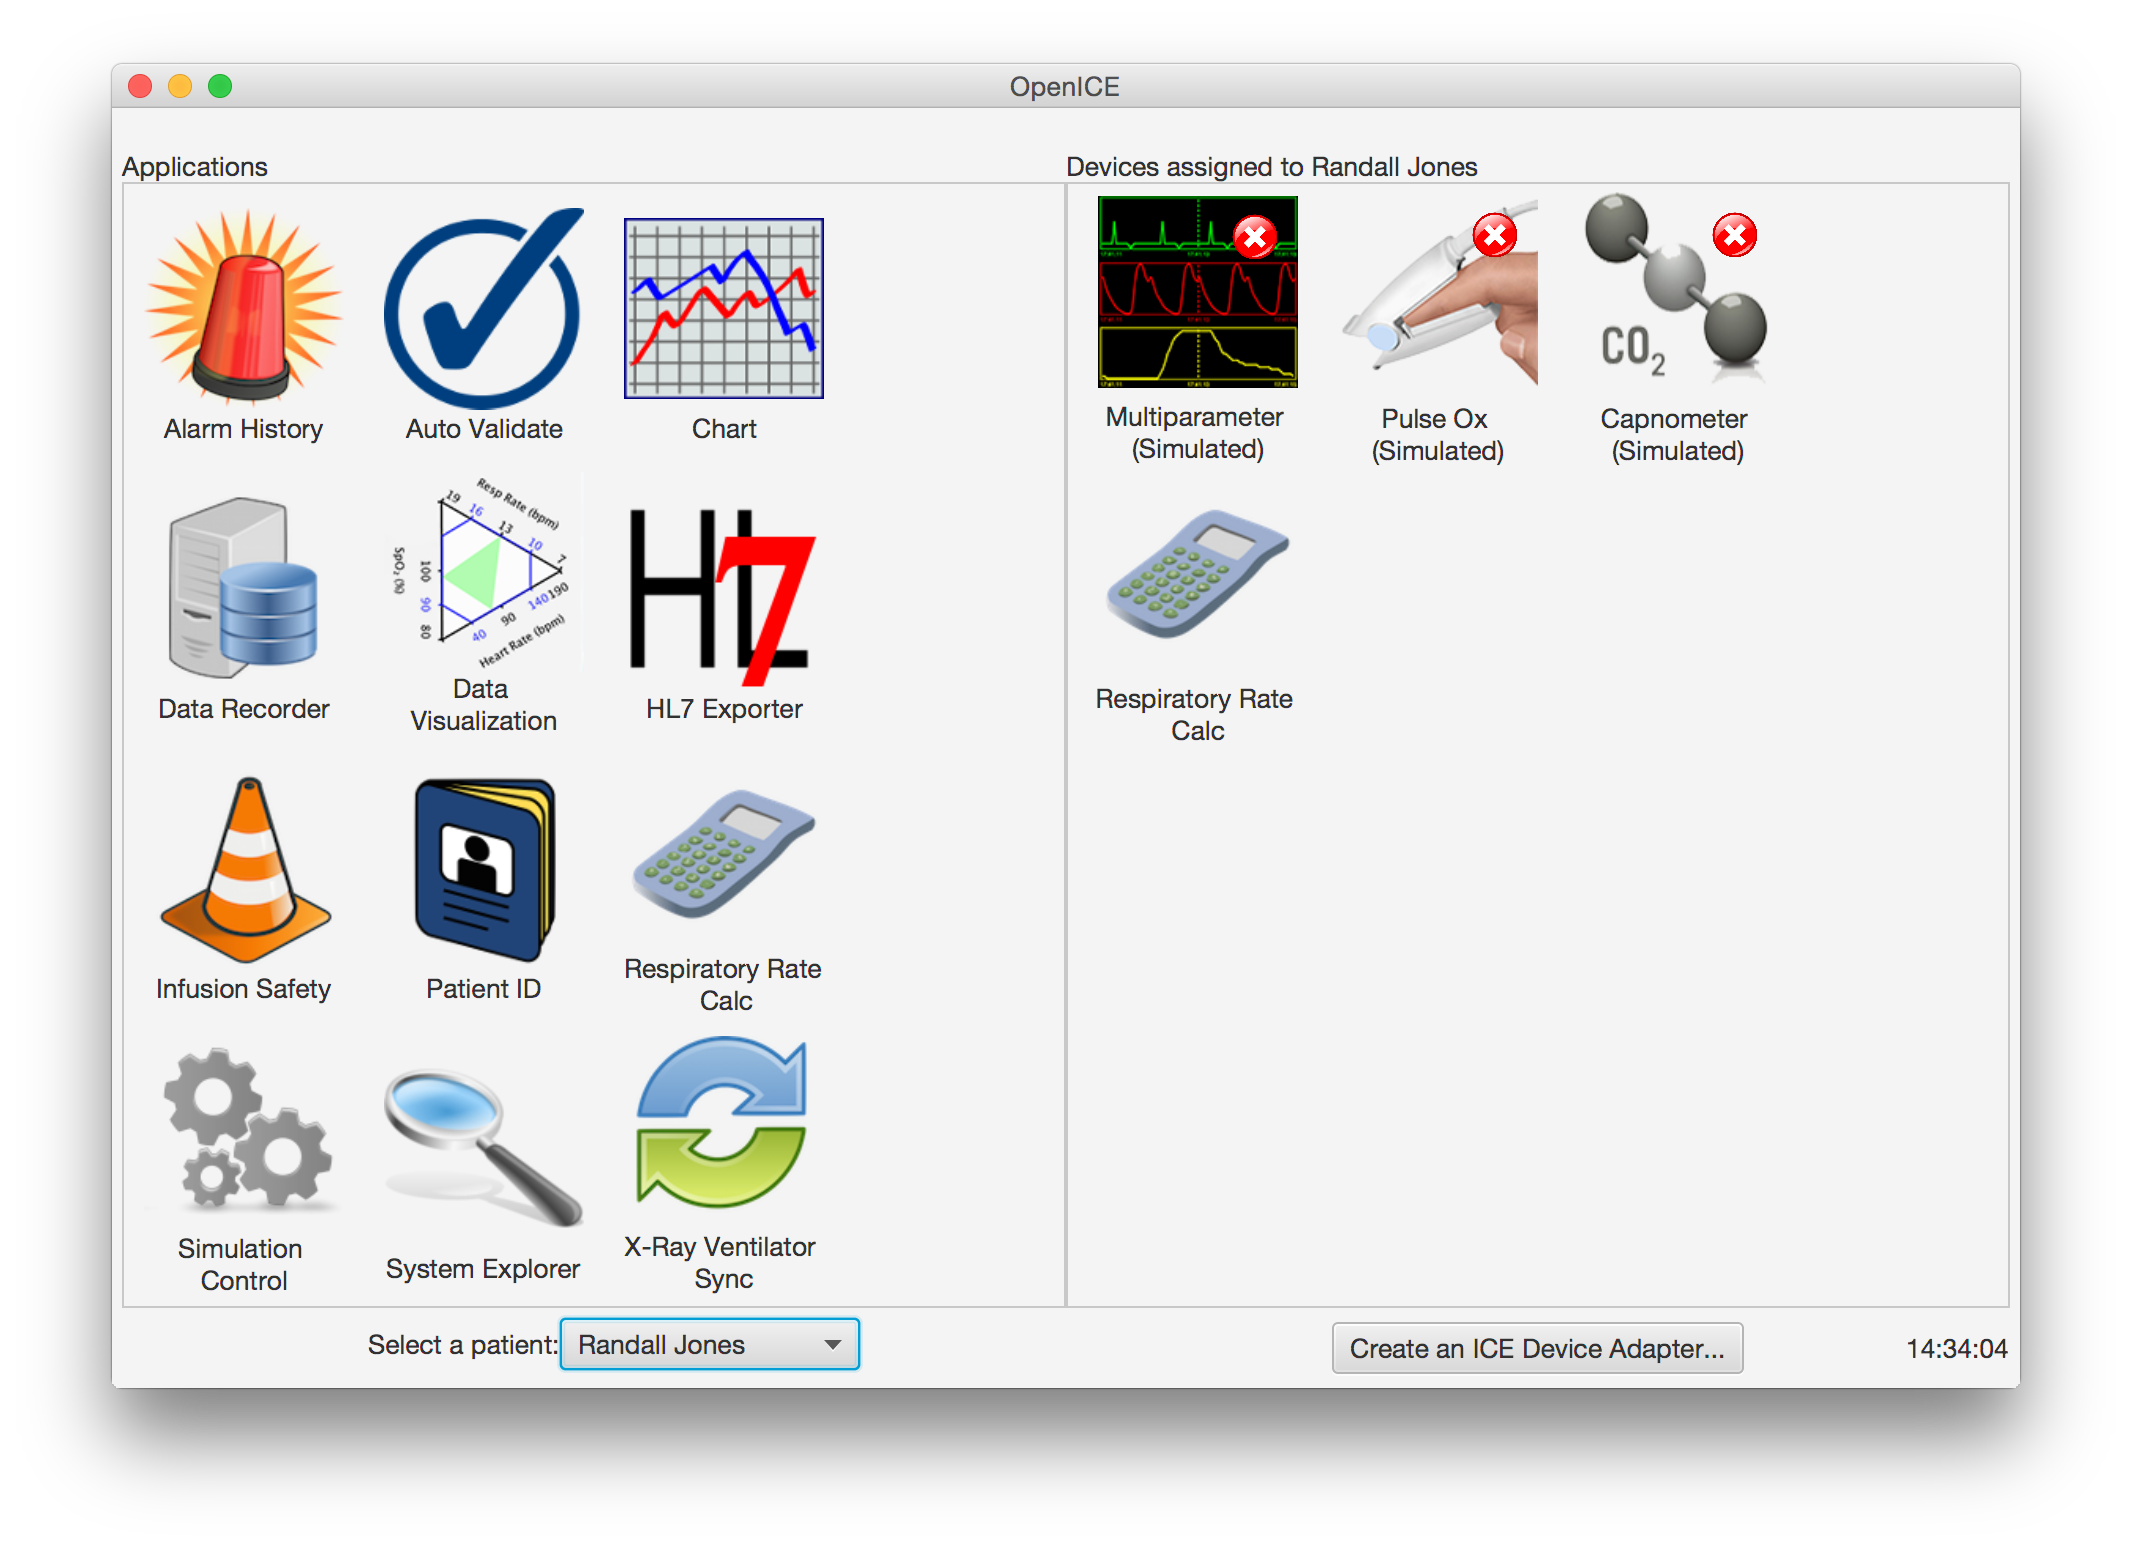
Example 2
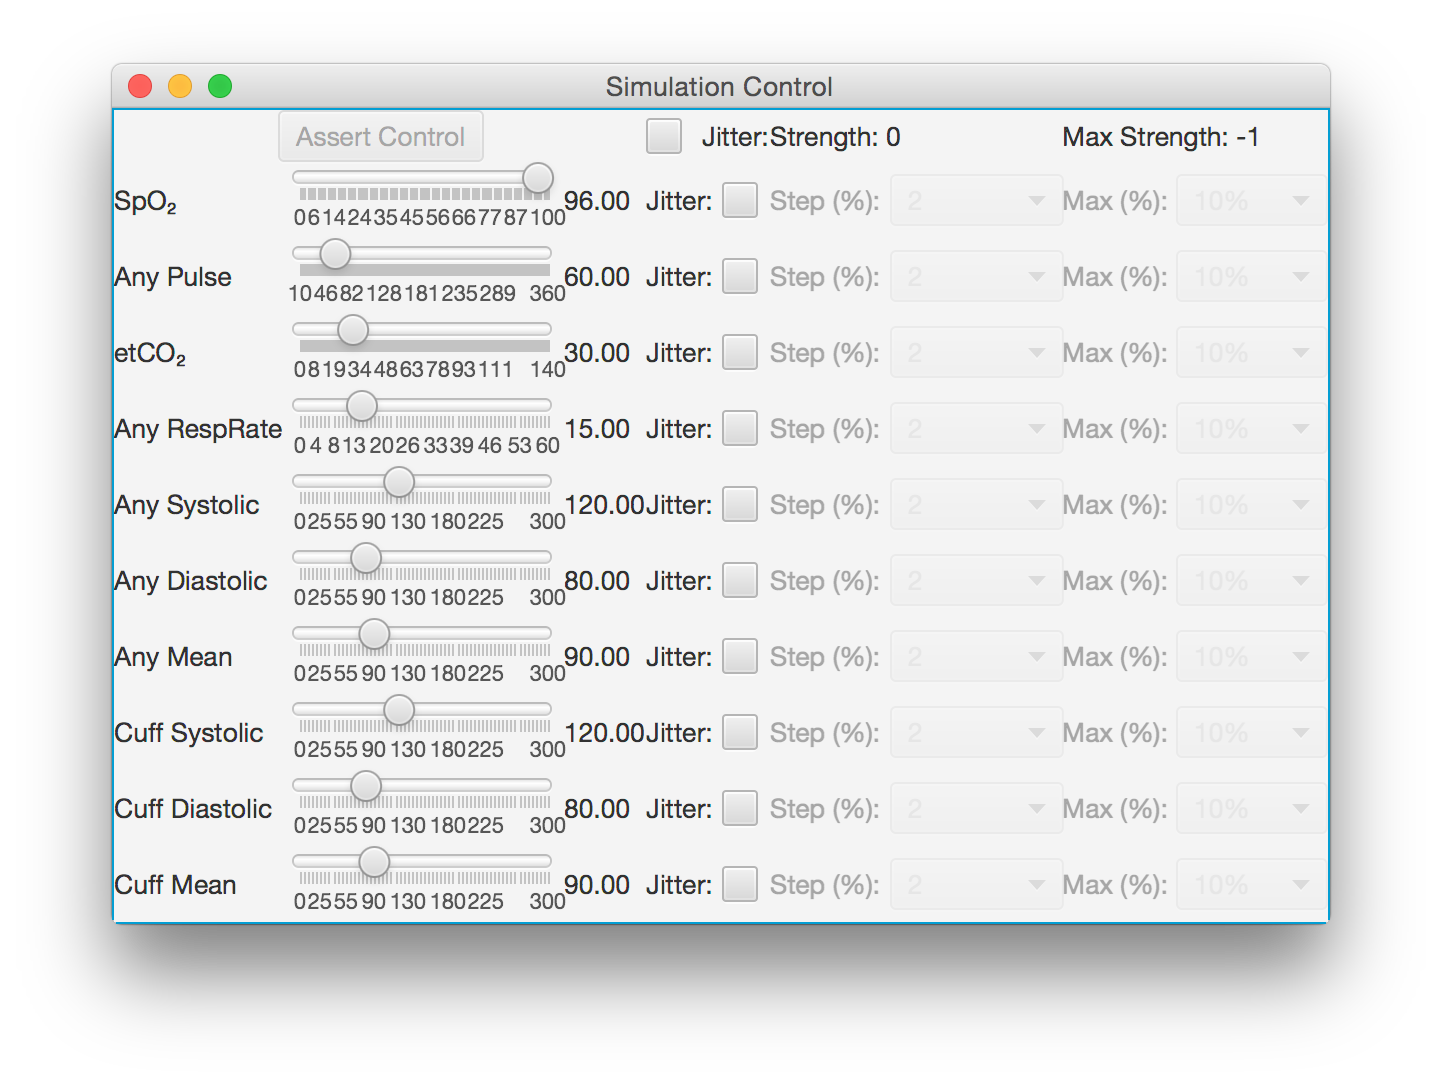
This app controls the value of the vital signs data emitted from the medical device simulators. The Simulation Controller will change all simulators connected to the OpenICE network in the current patient context. Only one Simulation Controller can be used in the OpenICE network at one time.
To adjust a specific vital sign, slide the marker to the desired value. To the right of the slider, the number indicates the simulated vital sign. For added realism, jitter can be added to the vital signs to vary their resting values. Click the jitter checkbox to the top of the app to turn on jitter. Next to each vital sign, check the box and select a step% and max%.
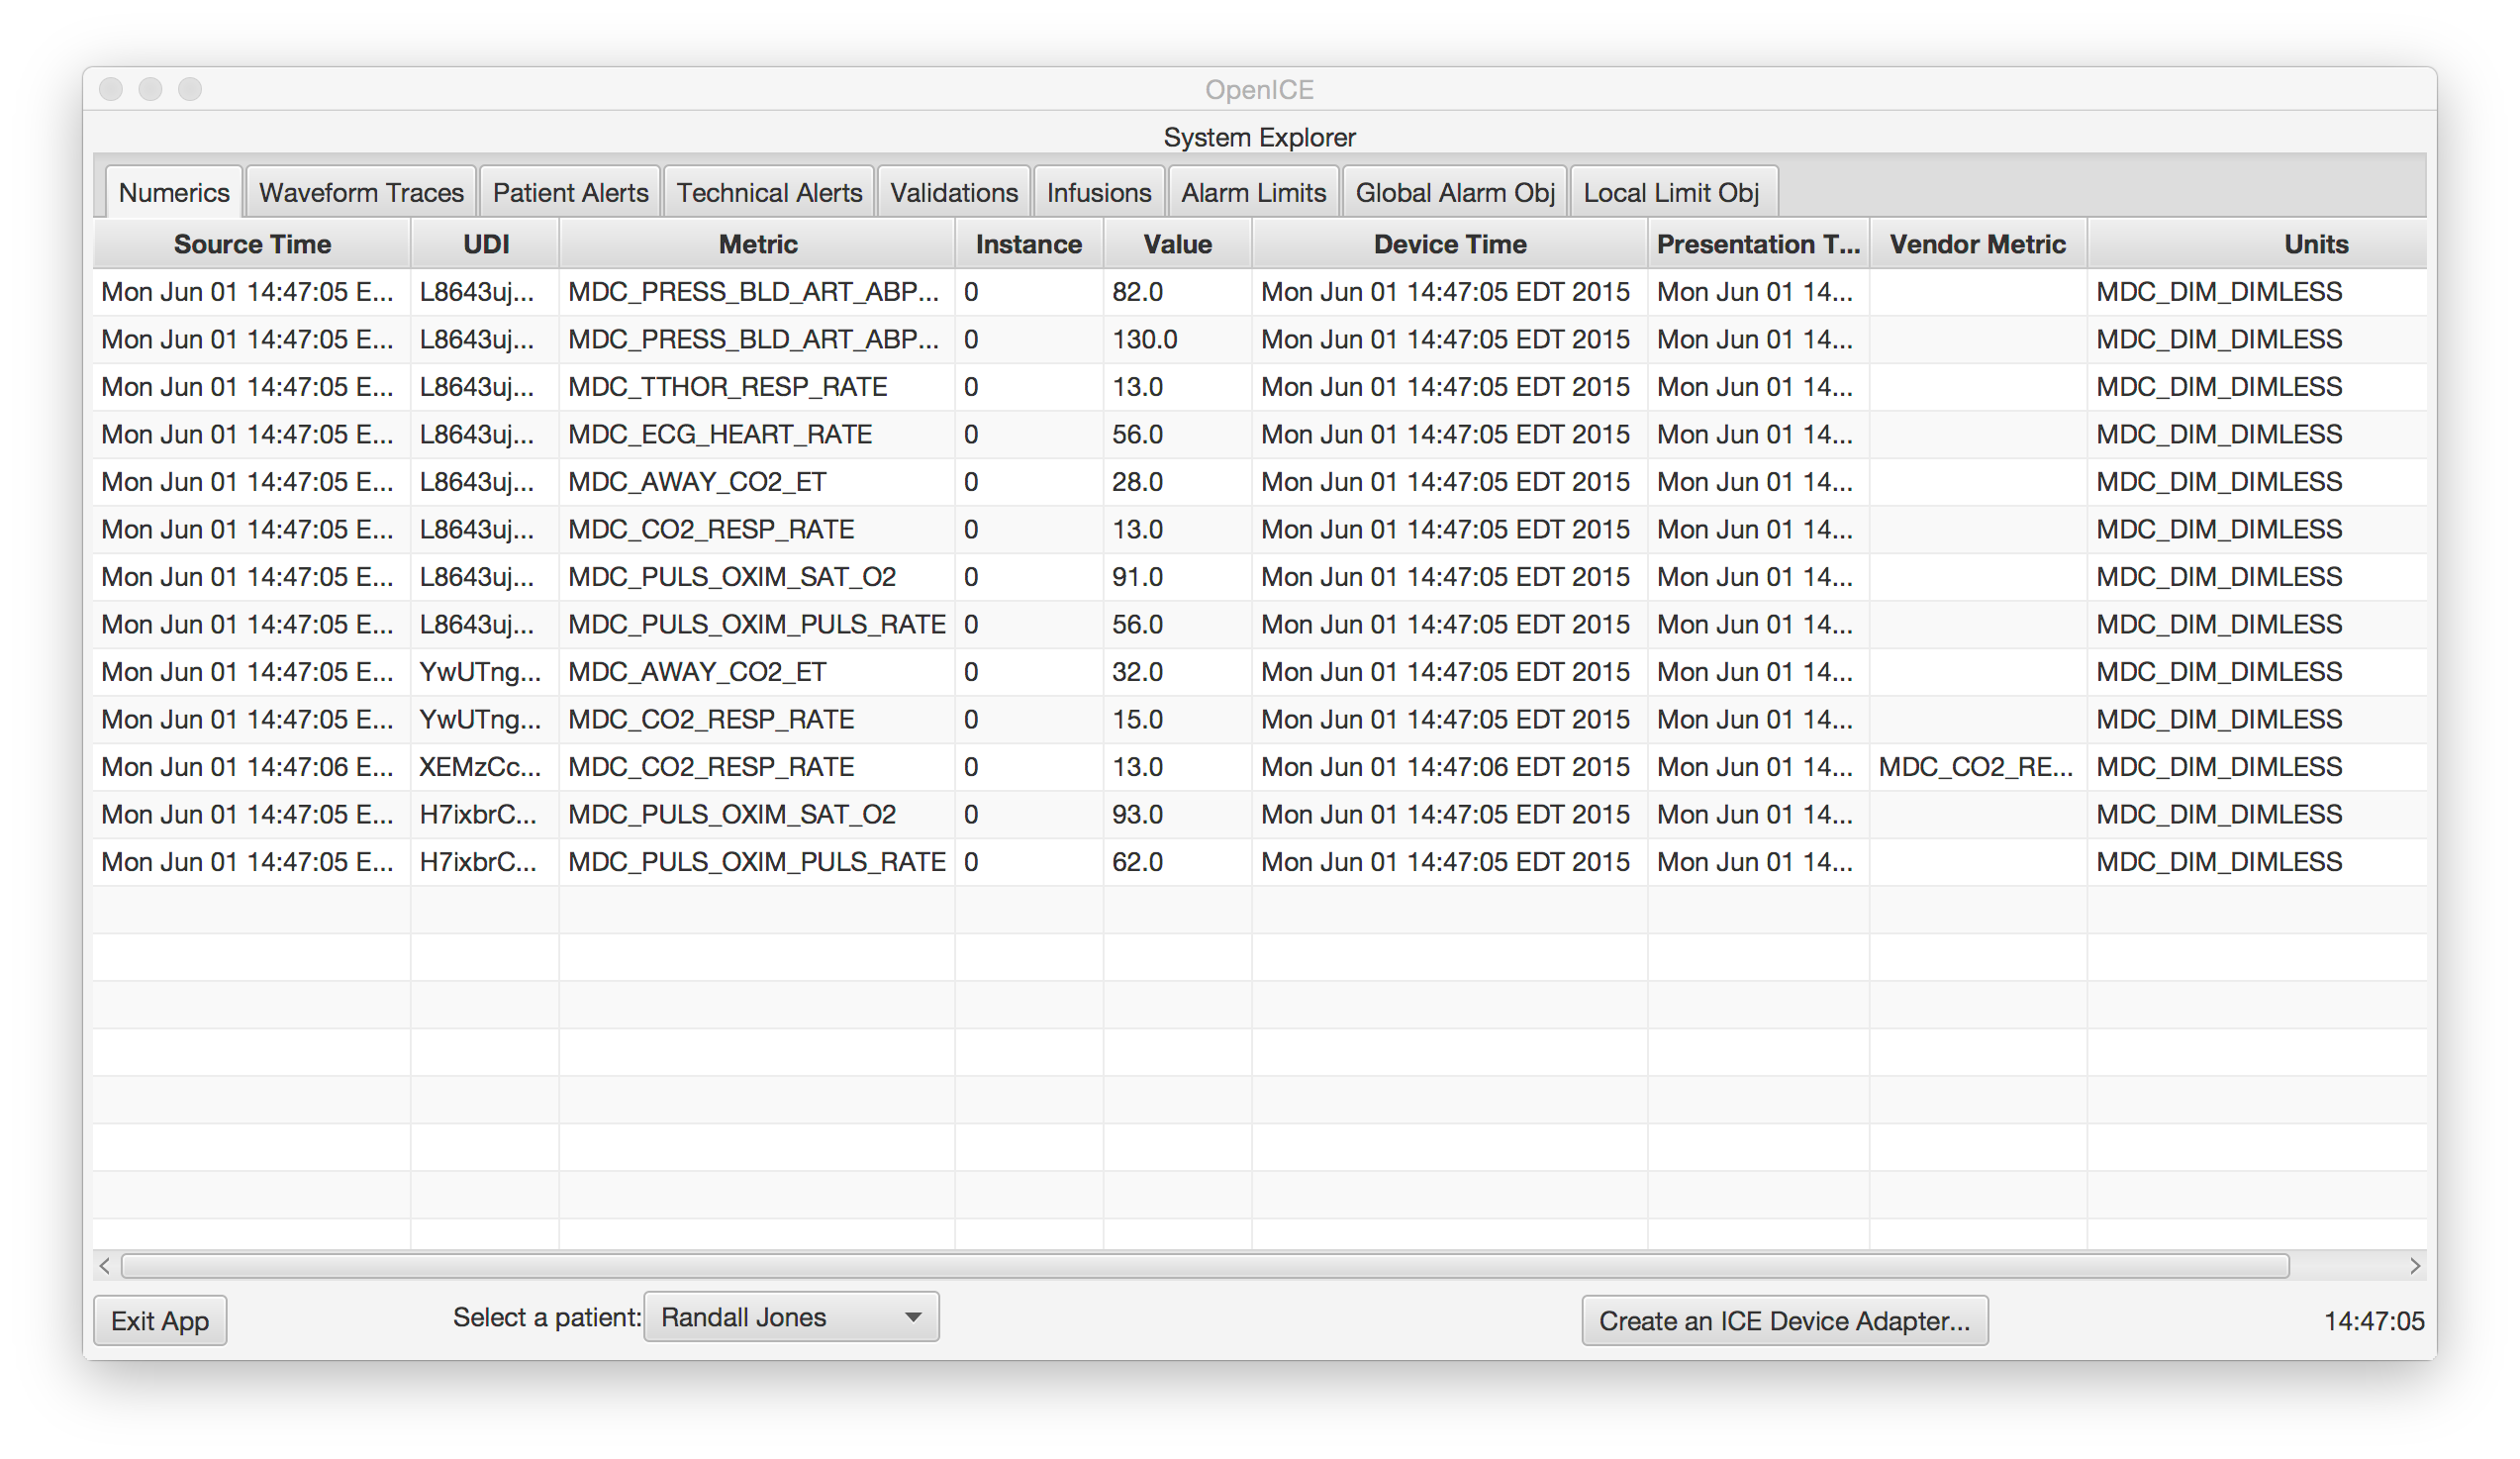
The OpenICE System Explorer is a tool for viewing all of the data that is currently available in the current patient context. This app is analogous to the Diagnostics Page. This page is useful for troubleshooting OpenICE - including verifying medical device data export protocols, device adapter software as well as network connectivity. The Supervisor promiscuously subscribes to all device adapters and simulators in the current patient context. If data is not displayed in the System Explorer app, it will also not be visible to other applications.
The tabs in the System Explorer app represent a DDS topic. Each tab contains a table that illustrates the structure of the topic. The rows of the table represent each instance of the topic. The rows contain the current data values found in OpenICE. You can learn more about the use of the DDS middleware from the OpenICE App Architecture description. Currently OpenICE uses the following topics:
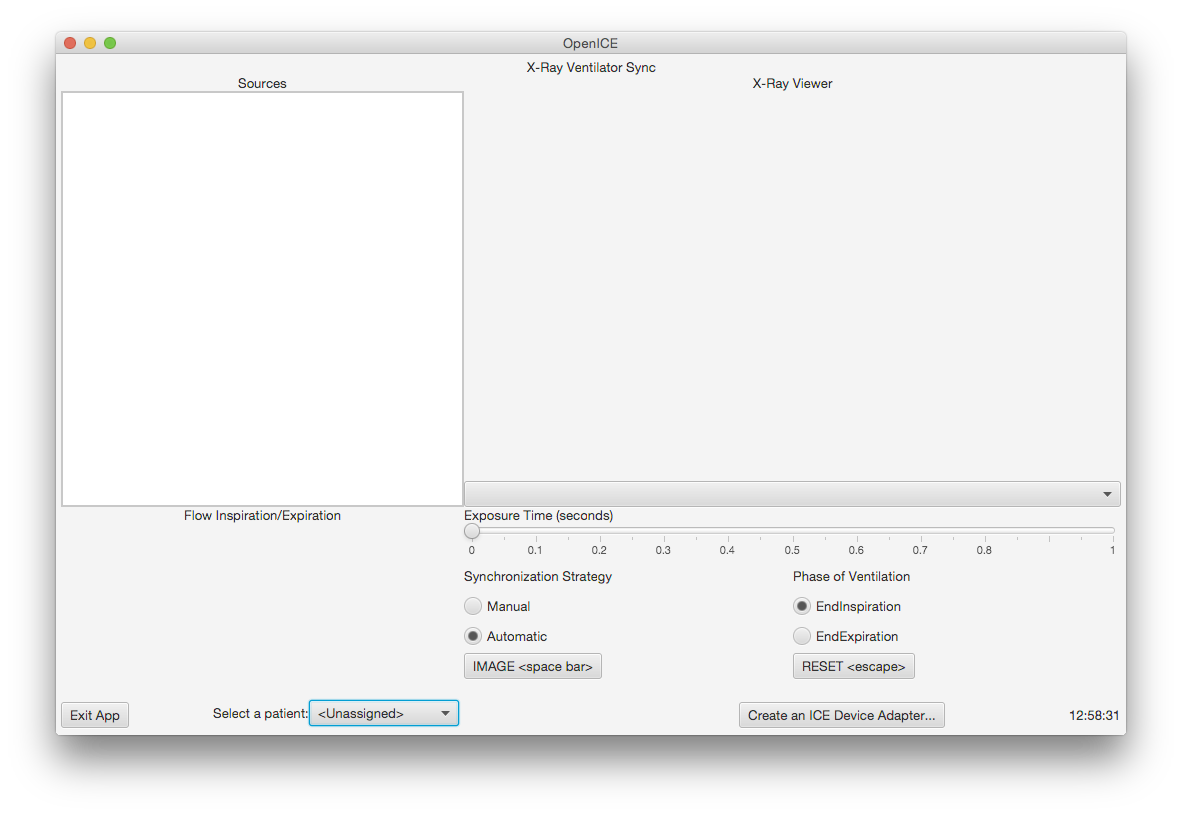
X-Ray Ventilator Synchronization is an exemplar use case for closed loop medical device control. Serious adverse events have occurred worldwide from operators forgetting to resume ventilation after an X-Ray is taken. The purpose of this app is to demonstrate an example safety interlock between a ventilator's pause functionality and the shutter of an x-ray. This app aims to take an fake x-ray (webcam picture) at a predetermined point in the phase of ventilation - either peak inspiration or end of expiration. This use case and app decreases the risk of human error found in hospitals today by automating a high risk process.
On the left side of the screen, the compatible sources of respiration will appear. Select the source you would like to use for synchronization. The right side of the screen will display the view field of the X-Ray (webcam). This can be used to image the synchronized respiration source to illustrate the image taken. The X-ray Ventilator app can be configured as follows:
1. Health Level Seven International. Health Level Seven International - Homepage. (n.d.) Web. Retrieved May 4, 2015, from http://www.hl7.org/.